Date Marker on Line Graph | Community
Skip to main content
Level 2
August 23, 2023
Solved

Date Marker on Line Graph

  • August 23, 2023
  • 1 reply
  • 1995 views

What I am looking for is a way to put a marker or arrow on a line graph in Workspace on a specific date when a process changed to show visually what the results are after the change.  Is there a way to do that in Adobe Analytics?

This post is no longer active and is closed to new replies. Need help? Start a new post to ask your question.
Best answer by Jennifer_Dungan

I am not terribly fond of the current annotations... before these were even released I found a way to graph this more visually.


My solution is posted on this question:

https://experienceleaguecommunities.adobe.com/t5/adobe-analytics-questions/graphics-edition/td-p/605264


Also, I posted a way to improve annotations more visually here (if you like it, please upvote):

https://experienceleaguecommunities.adobe.com/t5/adobe-analytics-ideas/make-date-annotations-more-visual-within-our-graphs/idi-p/605327


1 reply

Community Advisor
August 23, 2023

As per my knowledge, you can't directly add anything in line graph itself. However, you can always use text area and add details into it.

dlynch80Author
Level 2
August 23, 2023

I actually found that you can do this with annotations.  If you right click the line graph, you can add an annotation that shows a sticky note type icon at the bottom of the graph.

dlynch80Author
Level 2
August 24, 2023

Sometimes when I add older points on the graph they do not show up.  Is there a limit to the number of days back you can go on annotations?

As far as I know, no... but the "Applied Date" of the annotation must be within the Data Range of the Line Graph in order to show...


For instance, If my graph is showing last 30 days, I wouldn't see an annotation from 60 days ago... but if I change my panel to show the time frame where that annotation is, I should see it....


I found this note in the annotation but don't understand what it means (10 max)?

You can add up to 10 metrics on this date to annotate.


So in your screenshot, it's cut off before the first metric (which should be whatever you started the "Create Annotation" from), but you can add additional metrics here:


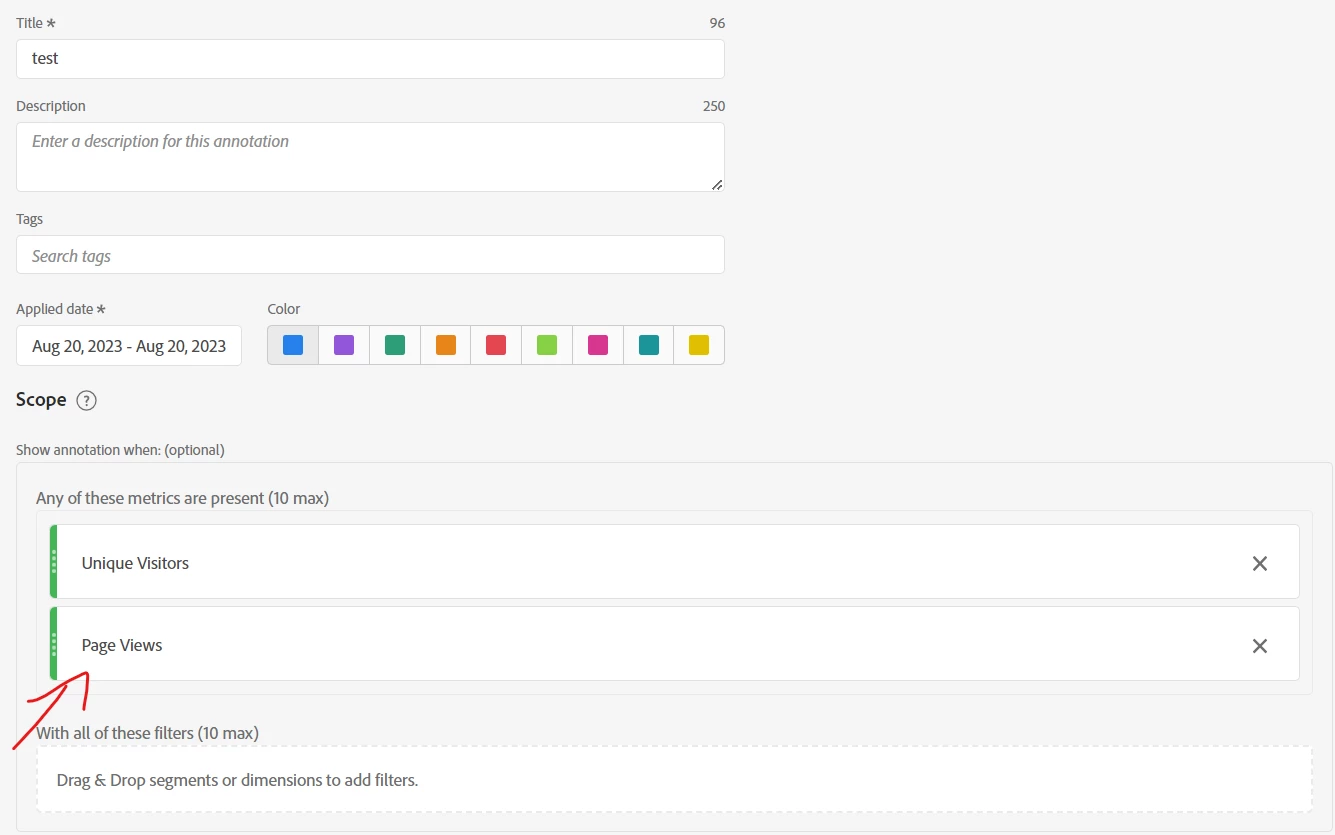
I guess if you are annotating some issue or spike it data, you can indicate which metrics were most impacted?


That's the odd thing.  I'm adding the annotation directly to the graph by right clicking and go through the process like I did on others, but it just doesn't want to show up.