Solved
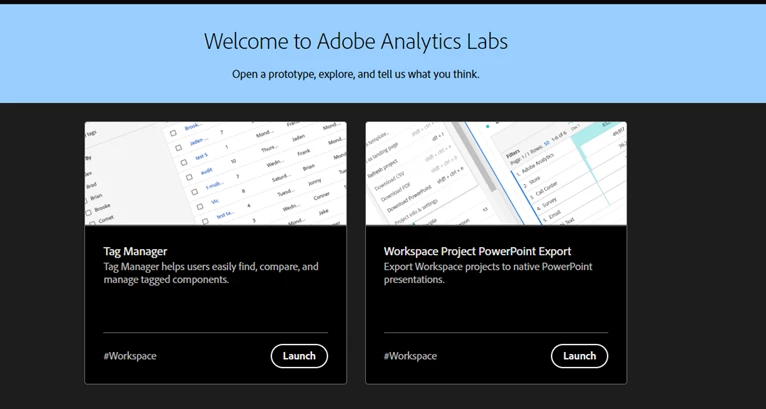
Adobe analytics labs option in Power point
Hi All, I need help with the below option on adobe workspace to Power point. Has anyone used this tool to get a report?
Hi All, I need help with the below option on adobe workspace to Power point. Has anyone used this tool to get a report?
Here is the discussion thread I authored on this.
It is not available for Flow and Fallout visualization. I used it few times. It's good that we will get the data and vizs in the powerpoint. I had to make some changes to make it look best. Still it is good to start with.
Enter your E-mail address. We'll send you an e-mail with instructions to reset your password.