

Say Goodbye to Data Downloads: 3 Powerful Visualizations for Business Decisions Without Leaving Adobe Analytics Workspace
Why do you download Adobe Analytics data to csv and analyze? This was the top question I’ve received during a recently concluded Adobe Analytics Champions' Tips & Tricks Webinar. During my sharing on Cohort Analysis so you don’t let your digital marketing campaigns fall in the cracks, I showed examples of sharing your findings to the rest of your stakeholders for them to understand and take action based on those analytics insights. Indeed, there are multiple ways to visualise your data for the best storytelling to compel business decisions.
Here are powerful visualizations that you can do without leaving Adobe Analytics workspace.
1. Time Series Using Line Graph
When is it most suitable:
Tracking a campaign daily based on a last touch channel. This is especially important for digital campaigns optimised for website visits (for LinkedIn) or landing page views (for Facebook) to see whether your ads are gaining traction based on the media buying objective.
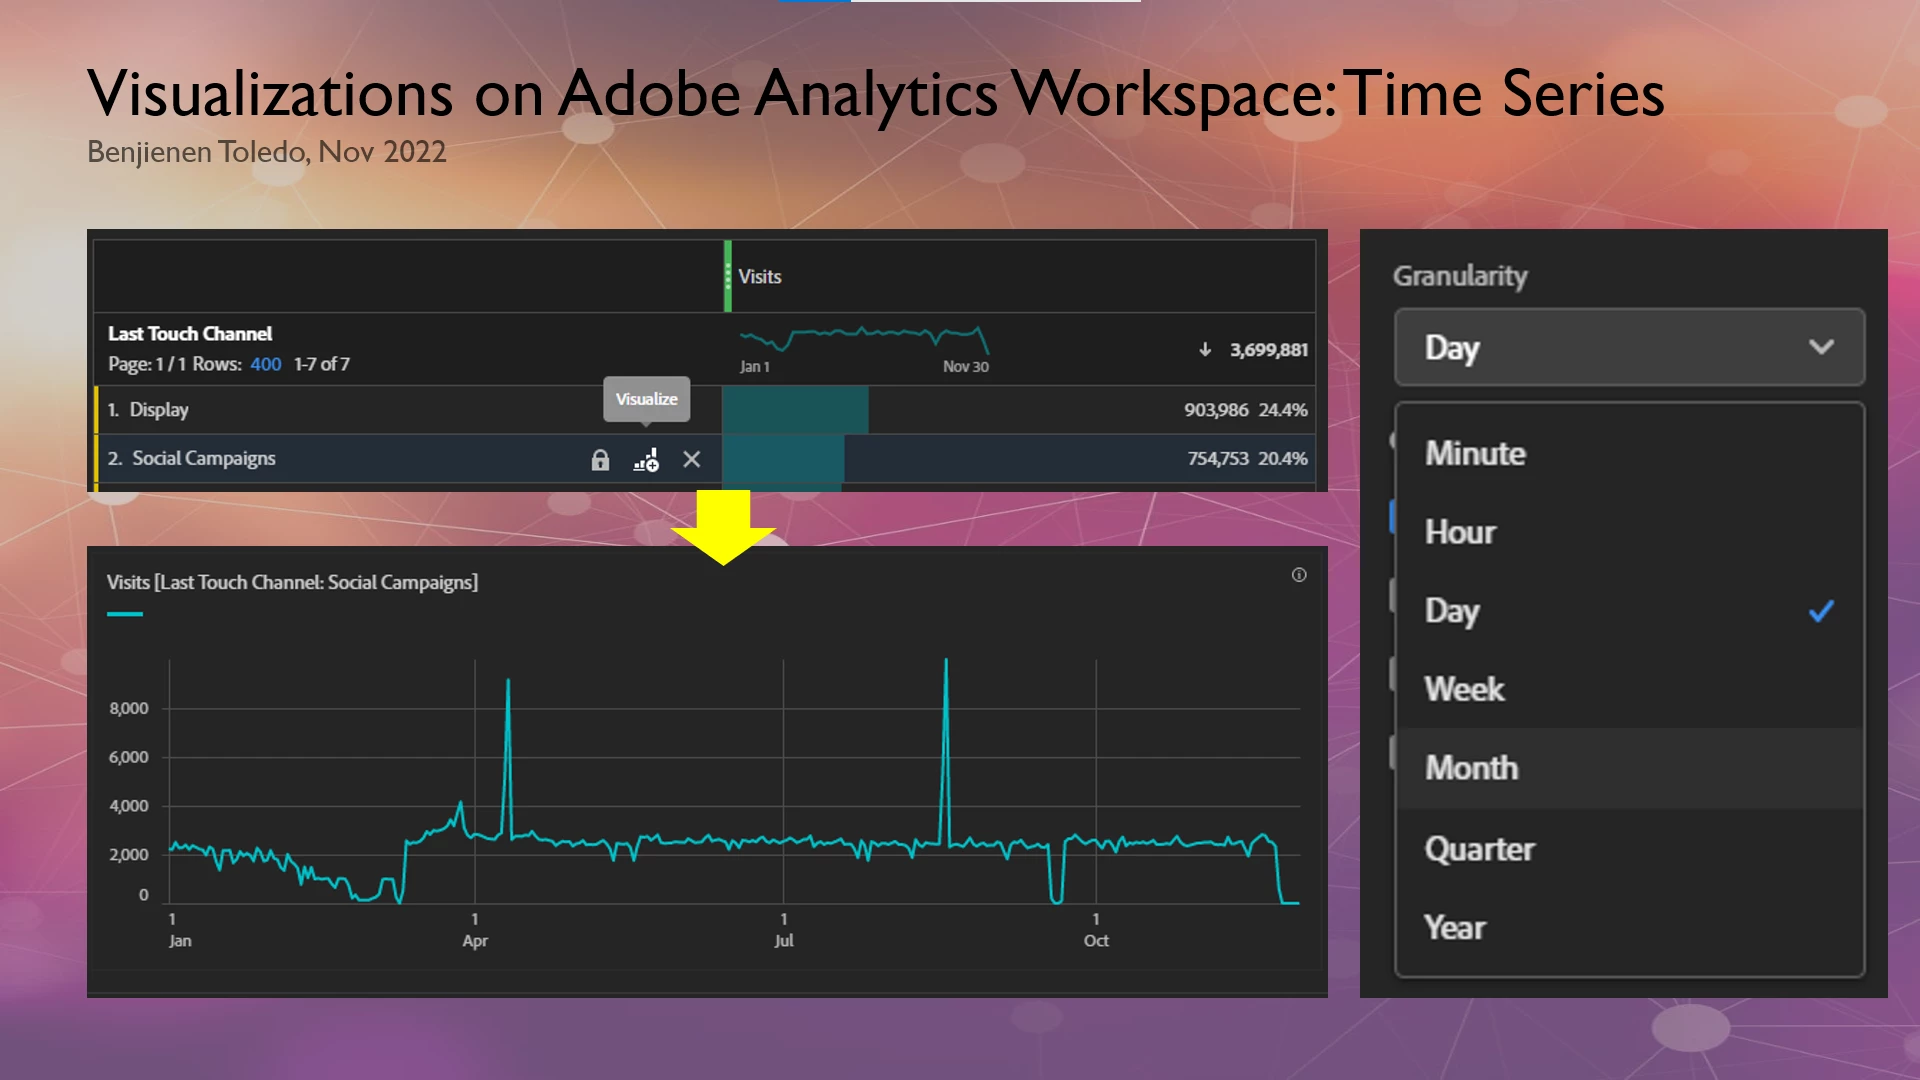
There are other time series granularity for line graphs on workspace, you can choose from minute to a year. You may use minute or hour if it is critical like consumer brands’ limited time sale. With this you will understand when the best time is to release promo codes, vouchers, or set products on sale. In my D2B experience, Day would suffice.
What to watch out for:
After launching your paid campaigns, the expectation is the website traffic will increase from that channel. If that is not the case, the ads may not be properly tracked. There are instances when paid search ads do not have UTM or tracking codes, the traffic had been attributed to natural search. So, the natural search traffic increased with very low traffic from paid search campaigns. With this you can’t accurately measure the impact of your paid search especially if there have been website conversions or leads.
Here is a champion tip to decipher the nuances of last touch channel attribution using Adobe Analytics.
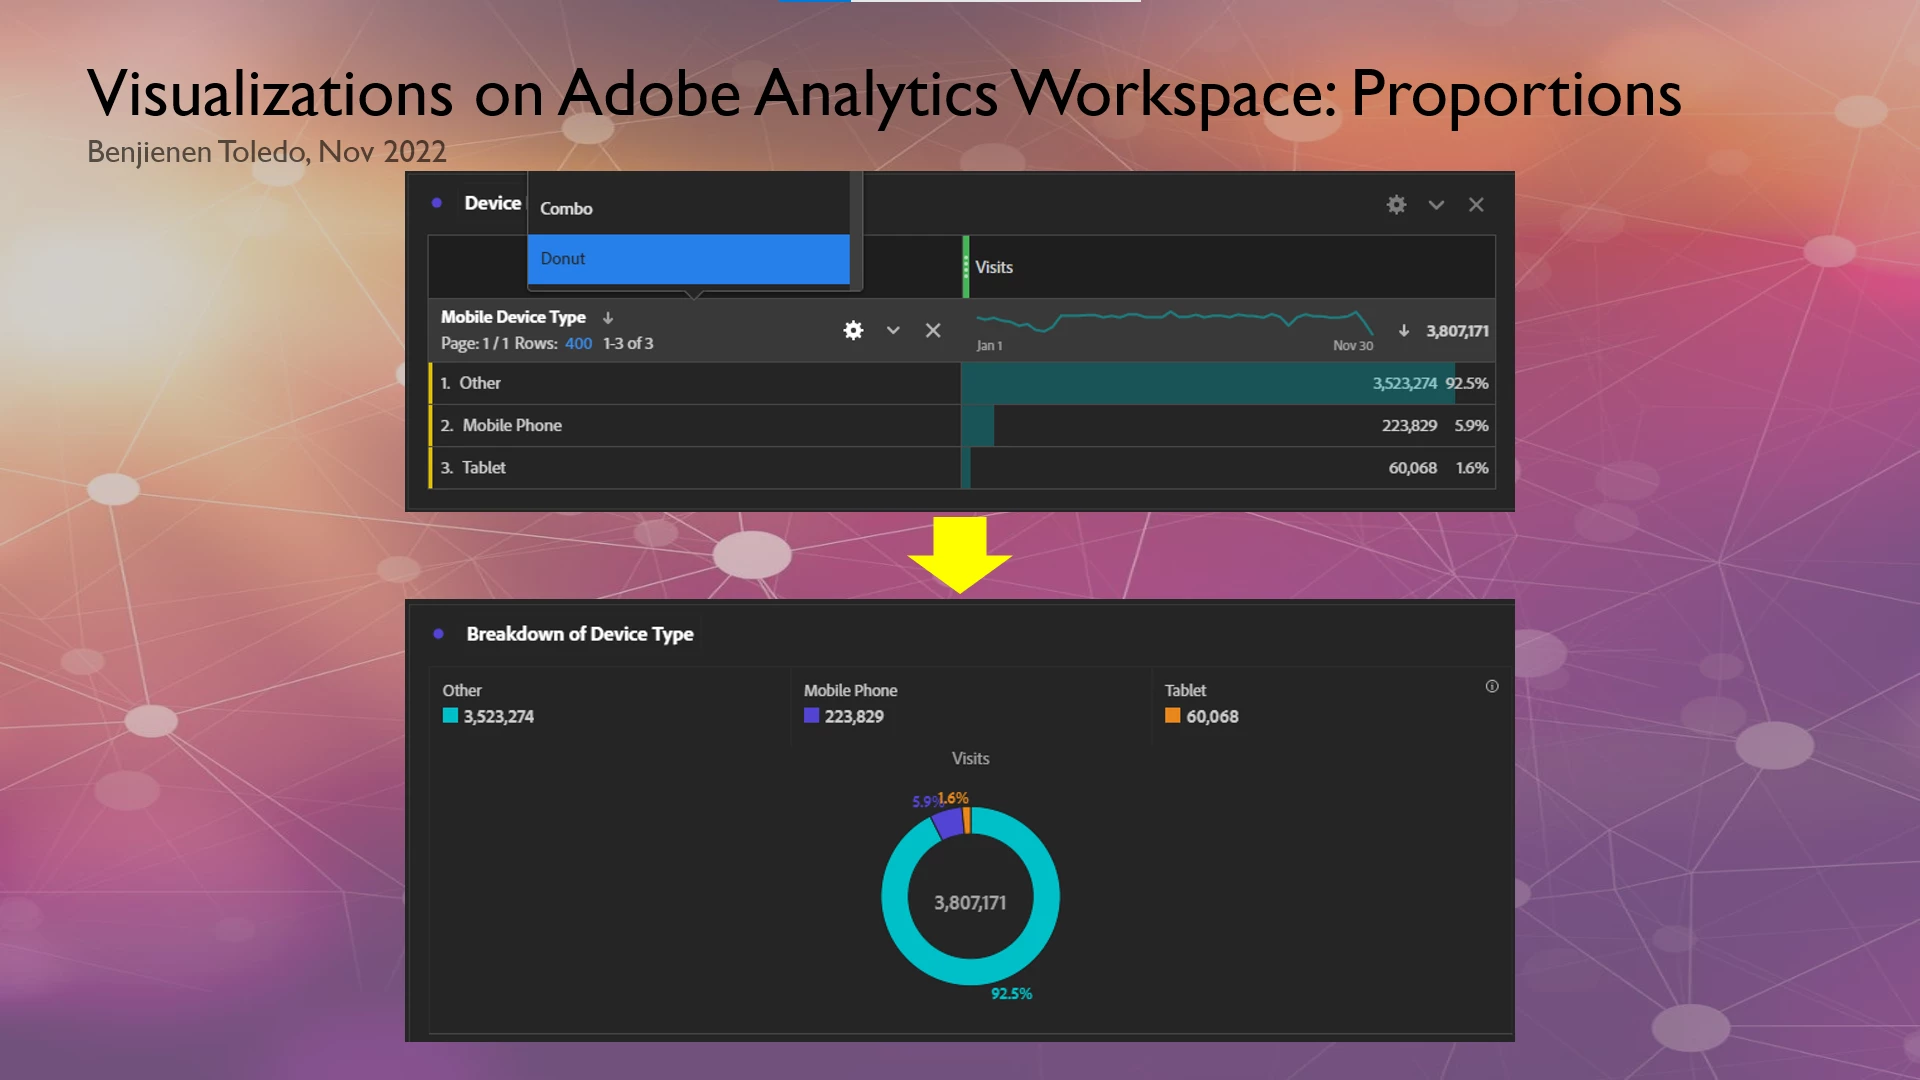
2. Proportions Using Pie Graph
When is it most suitable:
It is typically used for Device Type, Country, or Last Touch Channels breakdown. It will be more powerful to compare with your campaign success KPI such as downloads, form submissions, subscriptions, checkouts, etc.
What to watch out for:
In an example below, aside from knowing which channel brought the highest percentage of visits to your landing pages, you can also measure the quality of the traffic whether the audiences you’ve targeted are taking the desired website action such as Downloads.
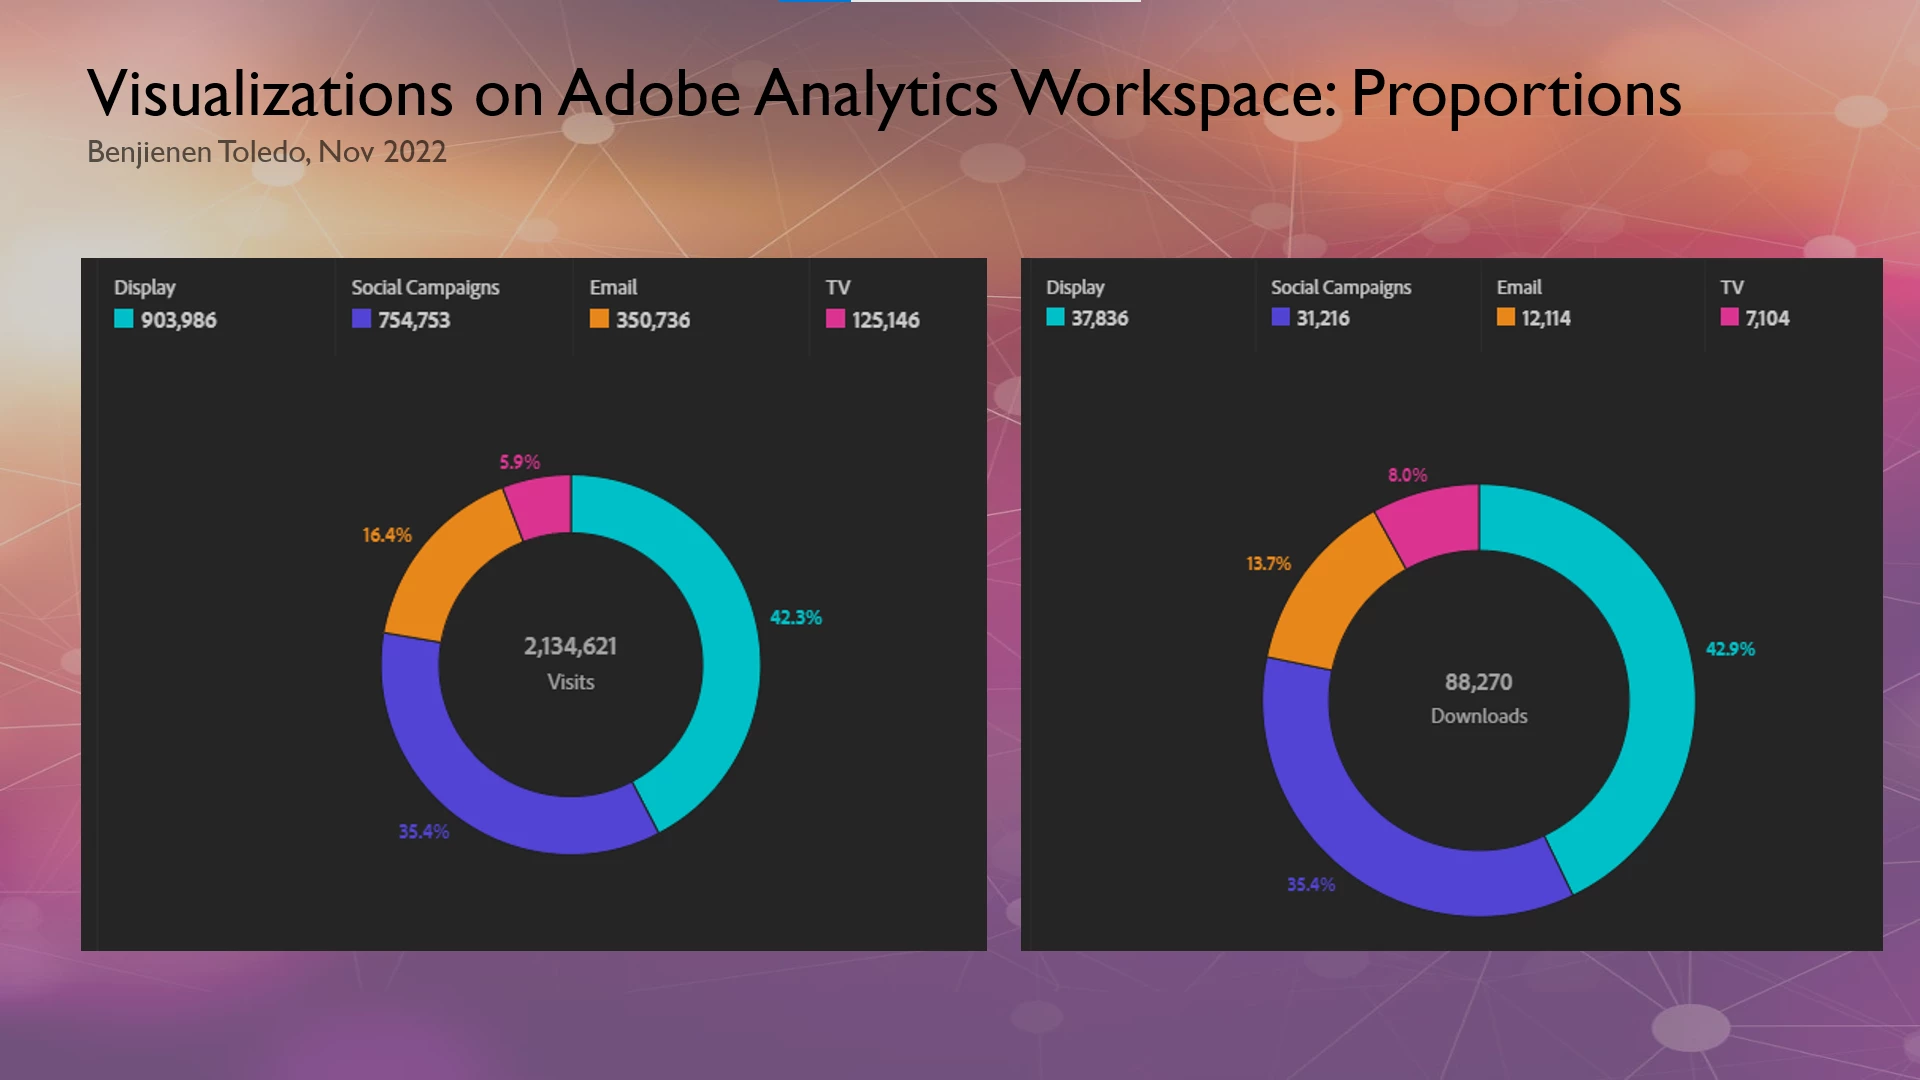
In the above chart, it is good to know that the proportion of downloads are aligned with the website visits. But Downloads from Email is slightly lower in proportion to its visits, while Downloads from TV is higher. In this case, you may advise your business team to invest more on TV.
3. Peak of User Visits or Web Activities Using Bar Graph
When is it most suitable:
After doing cohort analysis, you need to understand the best day and time is to reengage your audiences. You can expose the peaks using bar graph right at Adobe Workspace.
What to watch out for:
Understand when your audiences are most active on your site using Day of Week or Hour of Day. Or when they are likely to take the desire actions such as adding to cart or proceeding with the online purchase.
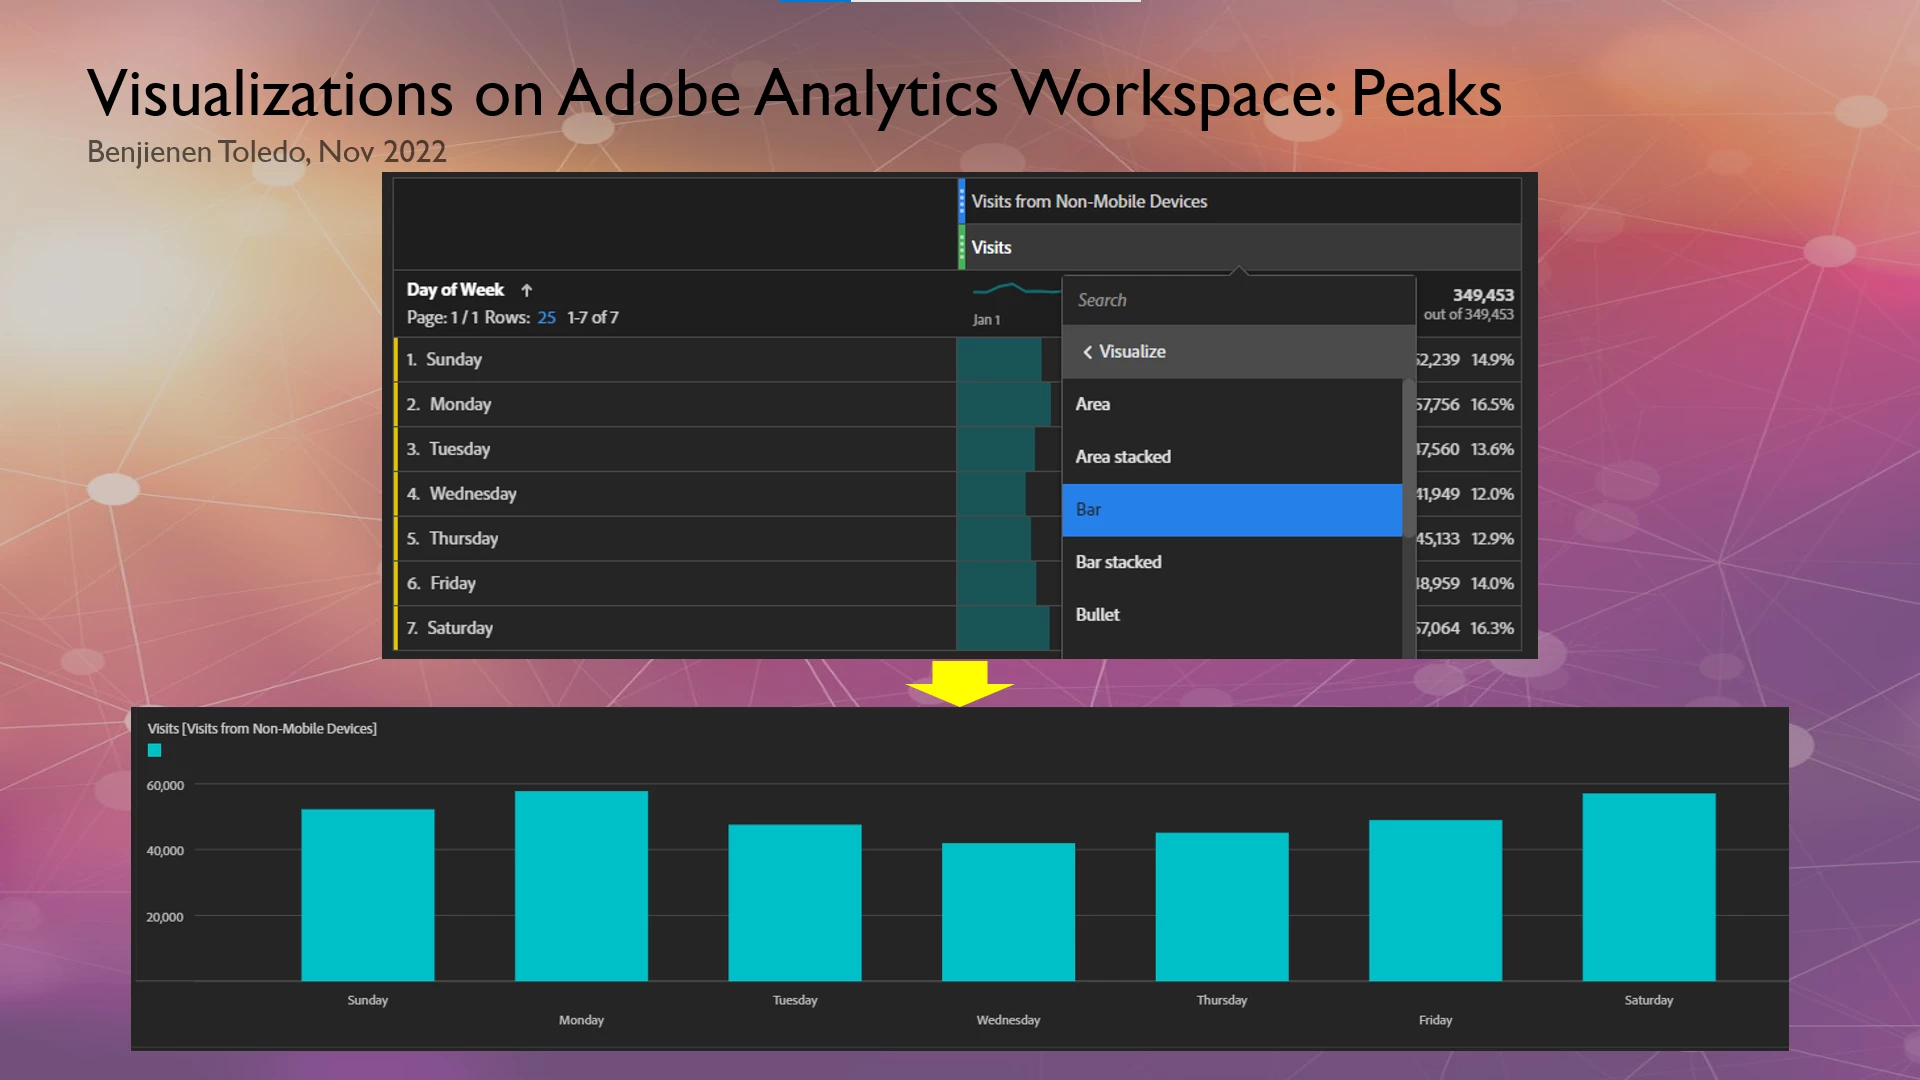
Above shows that web visitors who were on non-mobile devices generate the highest online revenue every Monday. This may be due to user behavior of researching over the weekend and making decisions after/at the start of the week which is Monday.
Try these out and let me know your thoughts on speed and efficiency combined right at Adobe Analytics workspace!