merging custom field from 5 different reports into a single column view | Community
Skip to main content
Level 6
August 13, 2018
Question

merging custom field from 5 different reports into a single column view

  • August 13, 2018
  • 14 replies
  • 1823 views

Hello All,

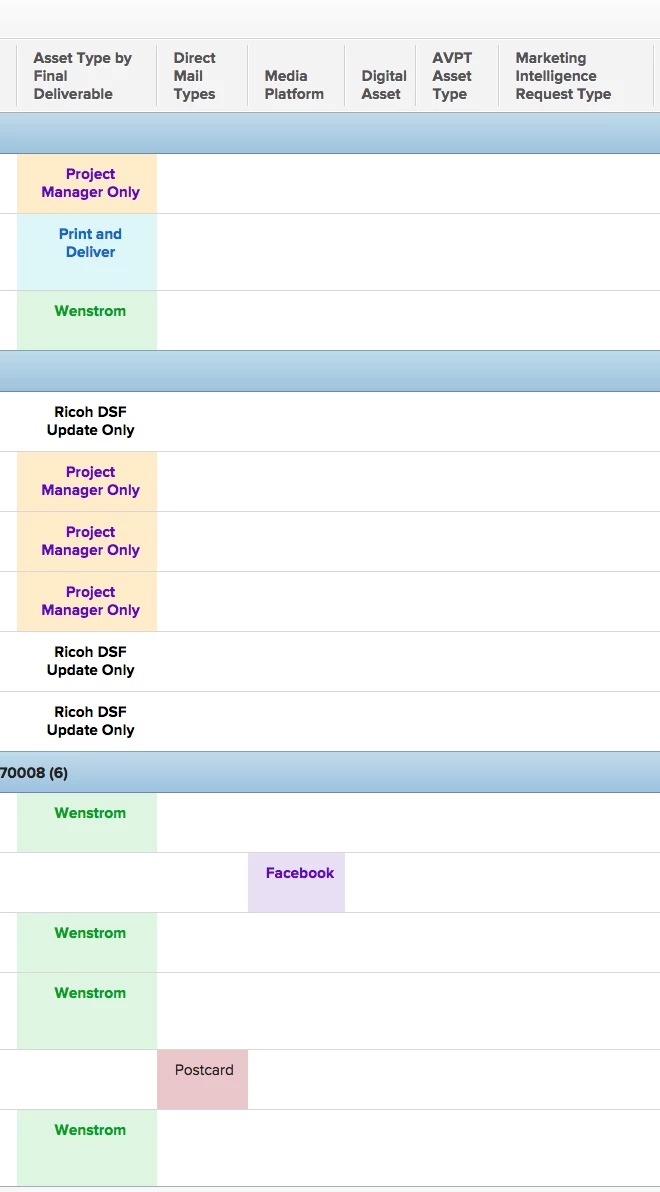
I have created a custom dash/report so marketing can see all their project assets in one view.

Because they need to submit a different form for print, signage, digital, social media and avpt etc...I have to show a sep column view for each one.

is there a way to combine them all into a single asset column??

this wasn't as important before but now we are using a single project for campaigns and this would be less cluttered with a single column.

This post is no longer active and is closed to new replies. Need help? Start a new post to ask your question.

14 replies

Level 9
August 13, 2018

use a sharecole option. Start with the first column and do it for evey single one you want to see within the first column.

Switch the columns to text mode and type:

sharecol=true

Also if you want to still see the heading follow below steps:

1) in between each column put a clear column

2) Starting right to the left, you go into columns and

- for columns not blank, you just need to add sharecol=true

- for the blank ones - use the code below:

Displayname= COLUMN NAME HERE

sharecol=true

textmode=true

value=<br><br><b>TITLE OF FIELD HERE:&nbsp;</b>

valueformat=HTML

results will looks like on the pic below. Obliviously will have more heading if you use more columns:)

Hope that makes sense:)

Level 2
August 13, 2018

If I can interject into this thread, it is great that you just posted this because I was looking for this exact thing and your tips worked perfectly. To take this one step further, I need to show my executive team a chart that shows the number of the various assets we create (Print, Digital, Video). In my ideal world, I would be able to show all three value types on one chart... right now I can only show the Print assets, OR the Digital, OR the Video. (Each of these are separate request types in our system). This is probably Reporting 101, but I have no clue how to do it and I've been in Workfront for over a year now!

So I need to show graphically what the combined columns show in the report. Is this possible?

Thank you!

Level 9
August 14, 2018
Hi Heather, unfortunately you come across everyone's pain - as soon as you use text mode syntax within columns/grouping, you cannot not pull those tailored information. Text mode sadly doesn't work within charts :( Dagmara Garwell BAKKAVOR LTD
Level 7
August 14, 2018
If you use a different custom form on each request & project type you could bring that value into the reporting without using text mode. Add the category name from the project and then group by that field. That should chart pretty easy without the use of text mode. Michael Lebowitz GuideWell Connect
Level 2
August 14, 2018

Thanks, Michael! I tried using the Category grouping and it was helpful to pull the Print/Digital/Video totals. I was looking for a way to have a chart that shows:

-Presentations

-Collateral

-Emails

-Interviews

-Website

-Landing Page

etc, etc. Basically, the subsets of those forms (usually in the custom form dropdown of Print Request Type, Video Request Type, Digital Request Type) all in one bar graph so we can see total amounts per asset type.

It sounds like I can't pull my combined column into a chart on a report. Bummer! The one drawback of reporting seems to be the inability to pull different custom form fields into the grouping for a chart.

Thank you!

Level 10
August 15, 2018

Michael/Dagmara, do you know if that would be possible with a calculated field?

Heather, I would probably set up a calculated field to read off all of your subsets. e.g. call the new calculated field "request type" and have it read what's in the various dropdowns of the various forms. (in each form, set up the same calculated field, but have the calculation refer to the relevant field of that form)

Then just do a grouping by the calculated field. I've only done this one time with a calculated field that reads off the Program name at the project level -- but we routinely use my little calculated field as a grouping for many different reports. It's very popular for one of my teams, I'm happy to say :)

Level 2
August 15, 2018

Okay, editing my post to capture where I am in this process.

#1, good to go on the calculated custom field just by using the field value.

However, I cannot use this calculated custom field on each custom form (Print, Video, Digital) because it is saying

"Request Types for Project Reporting field is used in a multi-form configuration, if you would like to change this formula you will need to remove this field and replace it with a new one containing the desired calculation."

Thanks!

Level 10
August 15, 2018

@Heather Lambert -- oh, so all three custom forms are on the request at the same time? This part stretches my calculated field knowledge a little bit but I think you get around it by basically saying in "calculation speak" something about the following:

If Print-Request-dropdown isn't blank, use this value;

If Video-Request-dropdown isn't blank, use this value;

If Digital-Request-dropdown isn't blank, use this value

BUT if you're using the same request to handle multiple pieces -- i.e. a single request contains a print piece, a digital piece, AND a video piece... well, this is not going to go well for your report. So it would be better if a single request contained a single piece. I would have to see your request setup to comment further.

(Edited to add: you may literally have to create a fourth form, put those three dropdowns in it, and then put your calculated field in it)

Level 2
August 15, 2018

@Skye Hansen - Thank you for your quick response!

Apologies if I was unclear; we have one piece per project, so just one custom form per request/resolving project.

On my Video Request Form, I have put a calculated field called "Request Types for Project Reporting" and the calculation is Video Request Type; however, when I go into my Print Request Form, I cannot use "Request Types for Project Reporting" and change the value to Print Request type. Does that make sense? In order for me to create the grouping in a report, I would need this Field name to be the same, right?

I feel like I'm *thisclose* to creating the chart that I need. Just missing something here!

Thank you!

Heather

Level 10
August 15, 2018

@Heather Lambert -- umm... I'm happy to jump on a web conference with you if you like? It's super hard for me to visualize, but I set something up in my sandbox, so tell me if this would translate to your situation.

I did issues because... it was easier. I had a few issues set up like this already.

Custom form 1:

* Custom field dropdown 1

* Calculated field 1 = (Custom field dropdown 1)

Custom form 2:

* Custom field dropdown 2

* Calculated field 1 = IF(isblank(Custom field dropdown 1),(Custom field dropdown 2))

Issues Report:

group by: Calculated field 1

Bar chart

I can show this to you via webex, or you can show me your instance and I can try and figure out what's going on?