FOLLOW UP: Adobe Summit S909 - Skill Exchange: Crafting Your Adobe Workfront ROI Story for Executive Buy-In | Community
Skip to main content
KierstenKollins
Community Advisor
Community Advisor
March 22, 2025

FOLLOW UP: Adobe Summit S909 - Skill Exchange: Crafting Your Adobe Workfront ROI Story for Executive Buy-In

  • March 22, 2025
  • 1 reply
  • 537 views

Good morning,

I hope everyone had a great Adobe Summit both in person and virtually. 

If you were in my session in person, I wanted to provide some follow up items that came up during the Q/A portion. 

  • 1. There was a question around managers and what they receive for reports. 
    • I referred back to the Creative Resource Management dashboard use case and that we do have separate dashboards for our creative managers. I mentioned taking a look at the Expert Insights post where I talk about this use case and show a few other graphs that were not in the Summit presentation. Check out the link below. If there are still Q/A's about the capacity charts, send me a DM if you would like to chat more.
    • Expert Insights On Demand Post & Video 
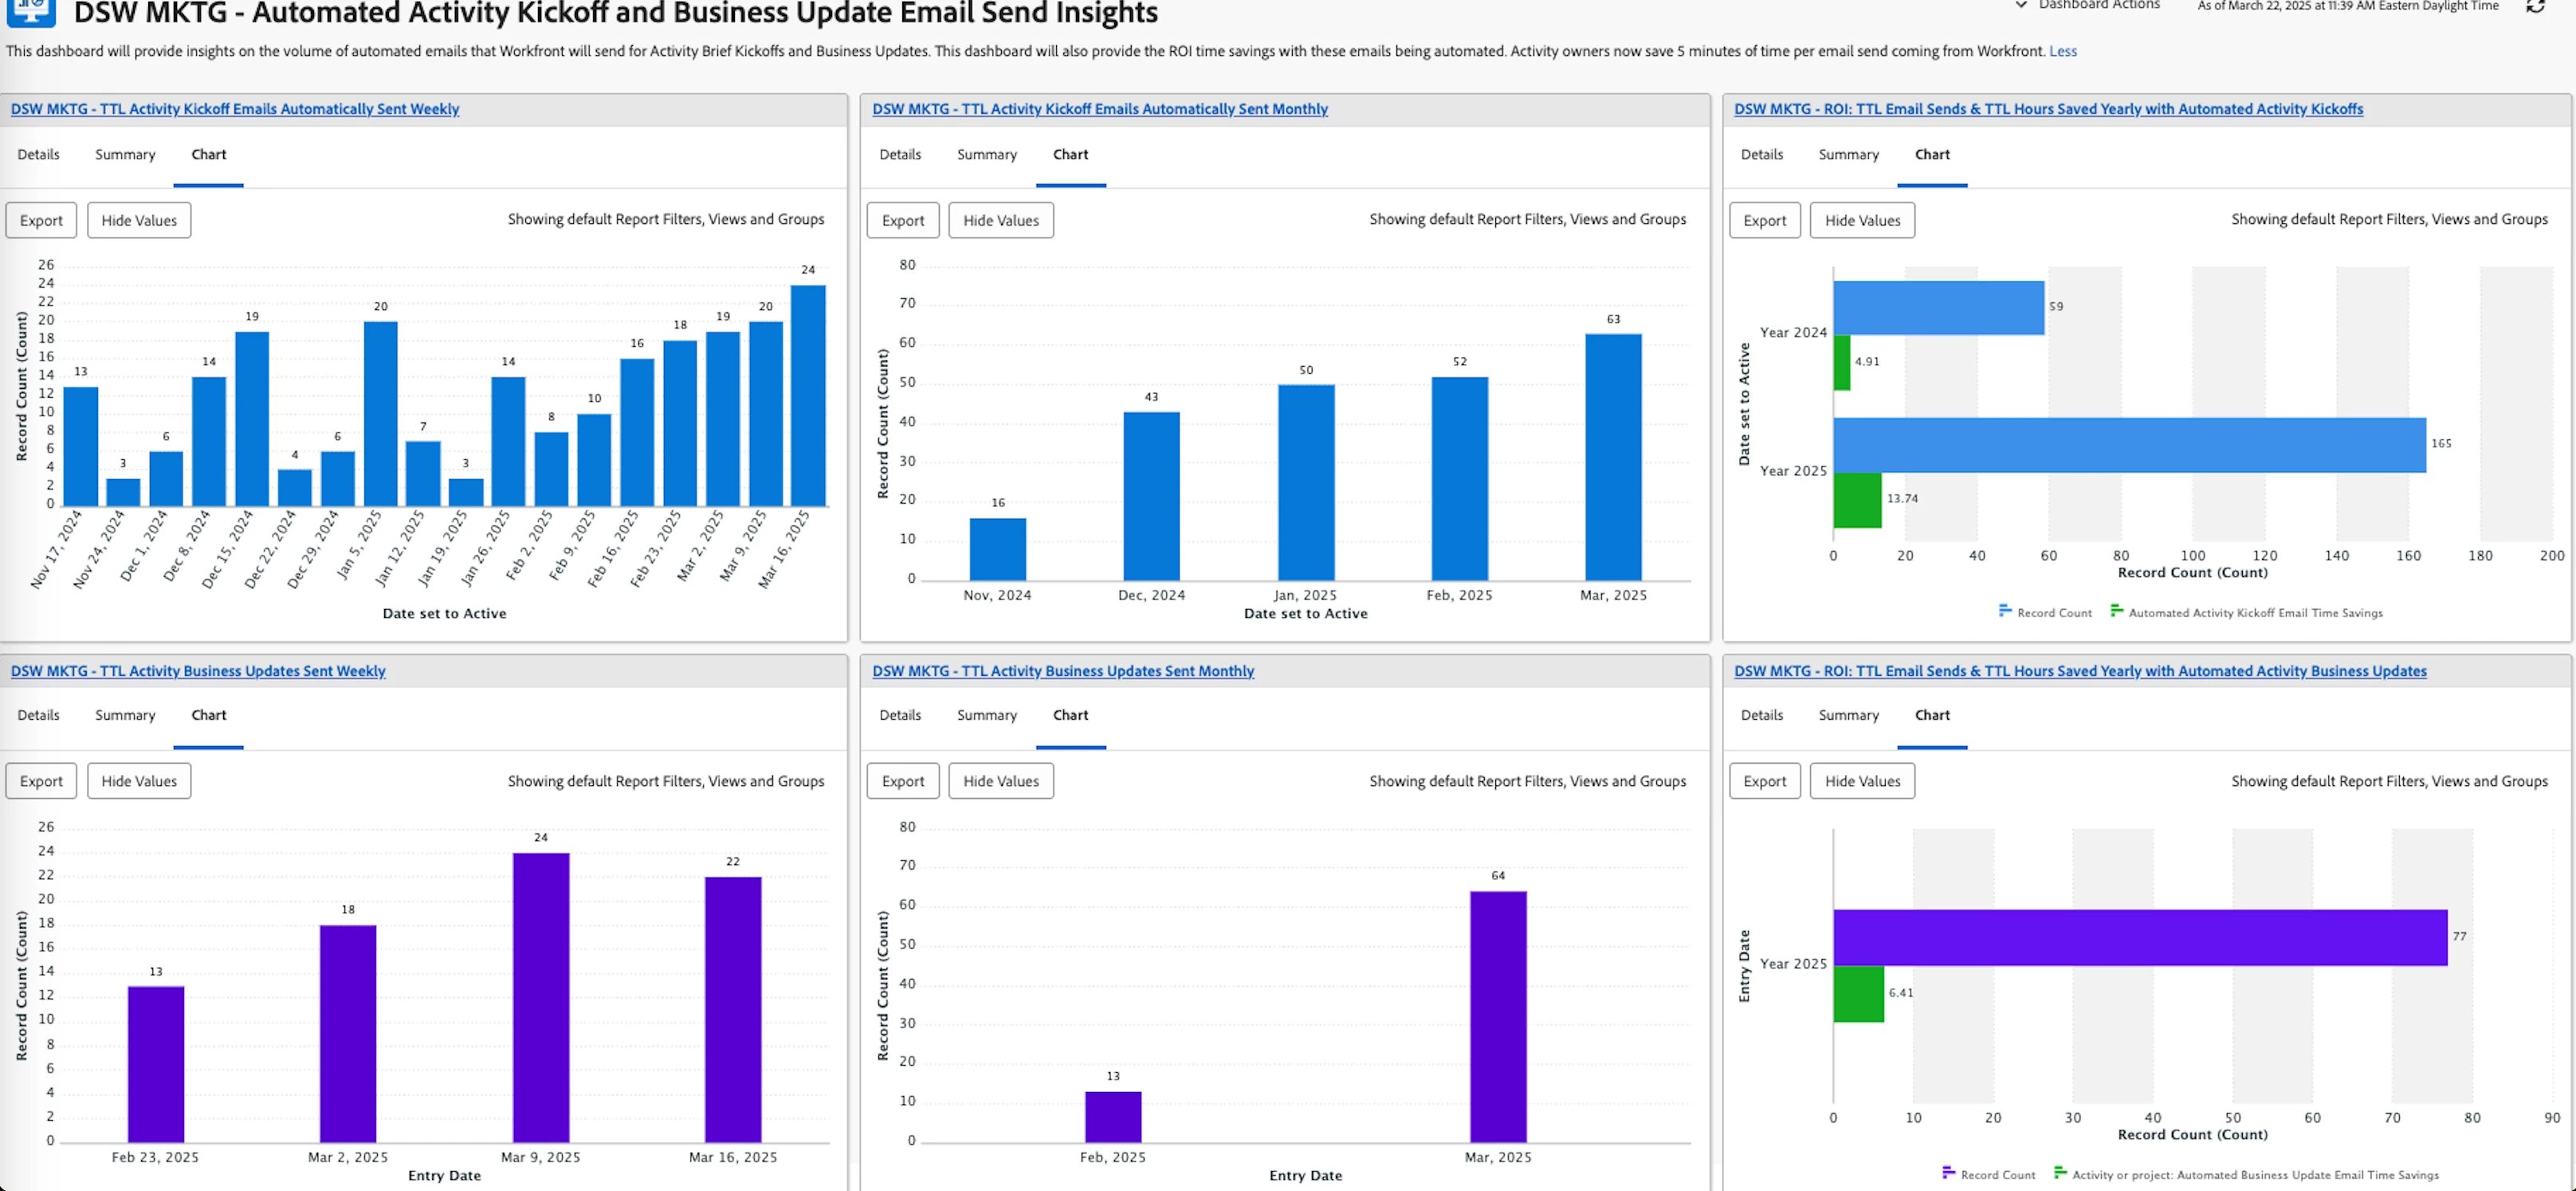
  • 2. There was a question around Fusion and some things that we are doing with it today.
    • I described a use case that we just implemented not too long ago to automate manual email sends to our department and business partners as every minute counts in our fast paced environment. I talked about how we created a dashboard recently that shows the volume of sends and the ROI time savings. This was not ready in time for the Summit, but I have provided a screenshot below on a very simple dashboard setup showing trends weekly, monthly and the overall yearly ROI time savings and counts.

Thanks,

Kiersten

1 reply

September 17, 2025

Hi Kiersten!

Loved your session!


Had a question - Specifically, I’ve been having an issue with combination charts. I’ve been trying to grasp the concept of how they work and specifically saw this report that used a combination chart but with a value I haven’t been able to get up.


I've been trying to recreate your report on the Creative Resource Management Leadership Dashboard, specifically the MKTG - Copy Hours Weekly - 4 Week View. At the end, I’d like to be able to have a line on a bar chart with the line showing the max capacity of hours in a week and the bar showing the hours planned. On the picture below, I see that you used a combination chart and selected Hours for Work Week as the value. This option doesn’t show for me as a value. Could you help with this situation?


Thank you!

KierstenKollins
Community Advisor
Community Advisor
September 18, 2025

Thank you @soukeynada!


The field "hours for work week" is a custom field in our environment that we built to support our resource management needs based on our team structure. In May this past year, I spoke at another event laying out our resource management build within Workfront. We use behind the scenes projects with dummy tasks to be able to pull in those numbers for capacity. Take a look at this Experience League post with the the video recording of this talk. 

https://experienceleaguecommunities.adobe.com/t5/workfront-discussions/event-follow-up-creative-ways-of-managing-resources-in-adobe/m-p/755660