Dynamic Reporting of Logins per User Role in Adobe Analytics | Community
Skip to main content
Level 1
February 23, 2026
Question

Dynamic Reporting of Logins per User Role in Adobe Analytics

  • February 23, 2026
  • 2 replies
  • 33 views

We have a requirement to create an Adobe Analytics report showing:

  • Logins per user role

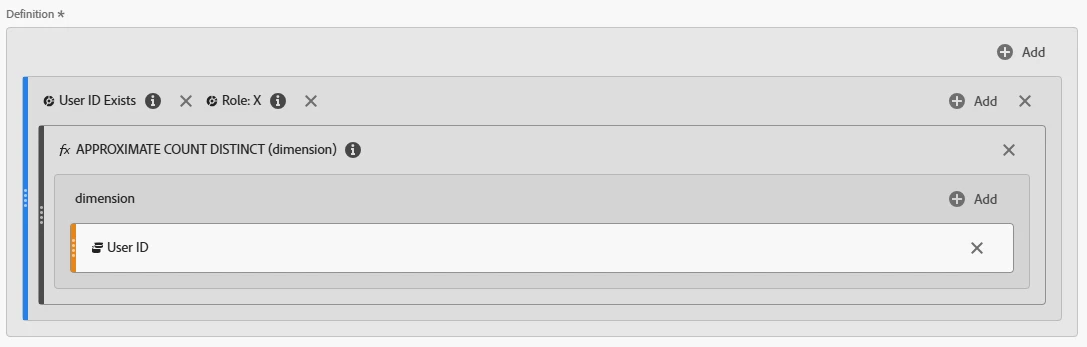
  • Percentage of users in each role who logged in (i.e., Number of users in a particular role who logged in / Total number of users in that role)

Currently, we can achieve this using a calculated metric with a static value for the total number of users in each role. However, this approach is impractical since the static numbers need to be manually updated whenever user counts change, and there are multiple roles to manage.

Our development team is ready to update the total number of users per role in the data layer. We can then capture this value in an eVar, prop, or event.

Question: How can we handle this in a way that ensures the total user count per role is dynamically updated in Adobe Analytics, without requiring manual intervention?

Note: Since this is a weekly report, the number of users in a role who logged in during the week may not equal the total number of users in that role.

Thank you in advance!

    2 replies

    Jennifer_Dungan
    Community Advisor and Adobe Champion
    Community Advisor and Adobe Champion
    February 23, 2026

    This is a tricky one… dimension data in Adobe is “text” so tracking the “total number of users” in any capacity wouldn’t be able to be used in a calculated metric….


    While you can track numeric values as a metric, the behaviour of a metric won’t work the way you want… 


    Trying to report on this in Adobe probably won’t work well (or really at all)… but, if you use something like Report Builder, then you could probably cast the “number as text” dimension with your total users per role to a number using Excel formulas.


    So, my suggestion:

    1. On each HIT (because you can also roll this up to Visits or Unique Visitors) - I would track dimension data for unique user identifier, logged in status, role, etc
    2. I would also track the number of users per Role on every hit in a dimension (prop or eVar) not metric (event - again because the way metric values will “add up” won’t get you the behaviour you want)


    So, now you have all your dimensions. You can get the number of “unique” logged in users in a time frame by looking at “Distinct Count User IDs”  (calculated metric - this will be more reliable than looking at straight UVs - since the same user might use multiple browsers / devices). You will need to make a calculated metric for each role)


    Something like:


    In Report Builder, pull in your data - distinct Count Users (by role). And your “total users per role”…


    Now, because you are looking at a time range, the number of users may have increased or decreased over that time frame (new users added, or user disabling their accounts, etc). So, you will have to choose how to isolate which version of the “total role count” you use.


    Then you will need to use Excel to choose the version, convert the total to a numeric value, then do you math and reporting all inside of Excel….  

    ManuS_Author
    Level 1
    February 24, 2026

    Thank you for the detailed explanation!

    Just to confirm, there are no alternative workarounds within Adobe Analytics itself to handle this situation dynamically if we proceed with building the report directly there, correct?

    Additionally, I wanted to note that we are currently tracking:

    • Login as an event

    • User ID and User Role as dimensions

    Jennifer_Dungan
    Community Advisor and Adobe Champion
    Community Advisor and Adobe Champion
    February 24, 2026

    Unfortunately, since you are trying to get a “percent of role” type metric, I can’t think of any way to do this directly in Adobe.


    Now, you did say “Logins per user role”, I took that more of a general “logged in” (as in a user who remains logged in for a long period of time and didn’t trigger a log in action within the time frame, is still a “login” when they come to the site - unless you don’t persist logins and force a “login action” on each session) as opposed to the actual “log in event”…. but the same problem pertains to both needs.


    If you try to save the “total roles” as a dimension (I am going to use a single dimension that uses classifications to split the values)


    s.eVarX = “role x:100,role y:50,role z:250”;


    This is text… it will still be text if you only sent “100” (as in you have separate dimensions for each role).


    In Adobe, you cannot convert the value of a dimension to a numeric value, so you cannot create a calculated metric that gets the “Distinct Count Unique” (or even “UV”) metric and divides it by “100”.


    Now, let’s say you attempt to send these as events


    s.events = “eventX=100,eventY=50,eventZ=250”;


    You would send this on every hit or every “login event”, etc…  let’s say this triggered 100 times (50 for Role X, 20 for Role Y, 30 for Role Z)


    In Adobe, you would actually see:

      EventX EventY EventZ
    All Visits 5000 1000 7500


    Because every time the event sends, it will add that count to the metric. While you could attempt to do some sort of solution where you divide each of these events by the number of hits (logins or hits where these values were sent, etc.), then use that result on your “user by role count”… there is a lot of room for some very messy math, and more potential failure points…..

    Level 3
    February 25, 2026

    Hi ​@ManuS_ ,


    If I understand the requirement correctly, below is how I envision the freeform table in the report.

    The panel date would use rolling dates for the last week, or possibly the current week.

    Proposed Freeform Table Structure

    1. Role

    2. Total Unique Visitors

      • Includes users who logged in during the period as well as users who already had an active session from a previous visit.

    3. Total Unique Visitors Who Logged In

    4. % of Unique Visitors Who Logged In

      • Calculated as #3 ÷ #2.

    5. Logins per User

      • Calculated as total login event occurrences ÷ unique visitors with at least one login event.

    Proposed Implementation Approach

    I attempted the following approach using my dataset, and the results appear to work as expected.

    Assumption:
    The user role is captured in an eVar and is populated along with the login event.

    1. Create a hit-level segment where user role exists.

    2. Apply this segment to the freeform table.

    3. Use the user role eVar as the primary dimension in the table.

    Metrics to Add

    • #1 Unique Visitors

    • #2 Unique Visitors (filtered by login event)

    • #3 % of users who performed a login

      • Calculated metric:

        Unique Visitors with Login Event÷Total Unique Visitors\text{Unique Visitors with Login Event} \div \text{Total Unique Visitors}Unique Visitors with Login Event÷Total Unique Visitors
      • When added to the table, this metric will automatically calculate the percentage for each user role.

    • #4 Login Event (Event metric)

      • Returns the total number of login event occurrences for each role.

    • #5 Logins per User

      • Calculated metric:

        Login Event Occurrences÷Unique Visitors with Login Event\text{Login Event Occurrences} \div \text{Unique Visitors with Login Event}Login Event Occurrences÷Unique Visitors with Login Event
      • When added to the table, this metric will show logins per user for each role.

    Example from My Dataset

    For reference, in my implementation:

    • Event 1 is used for click tracking.

    • Prop18 captures the link name.

    • The login event tracks prop18 = "reg-login-login".

    • Event 1 fires on login along with the user profession.

    In your case, the same logic would apply, except user role would be used instead of user profession, and the variables and events you have implemented.

    If you want weekly trend reporting, then may be you can build the line charts on this freeform table, and change the panel date range to the wider timeframe.

    Attached is the configuration of freeform table:


    Thanks,
    Nitesh