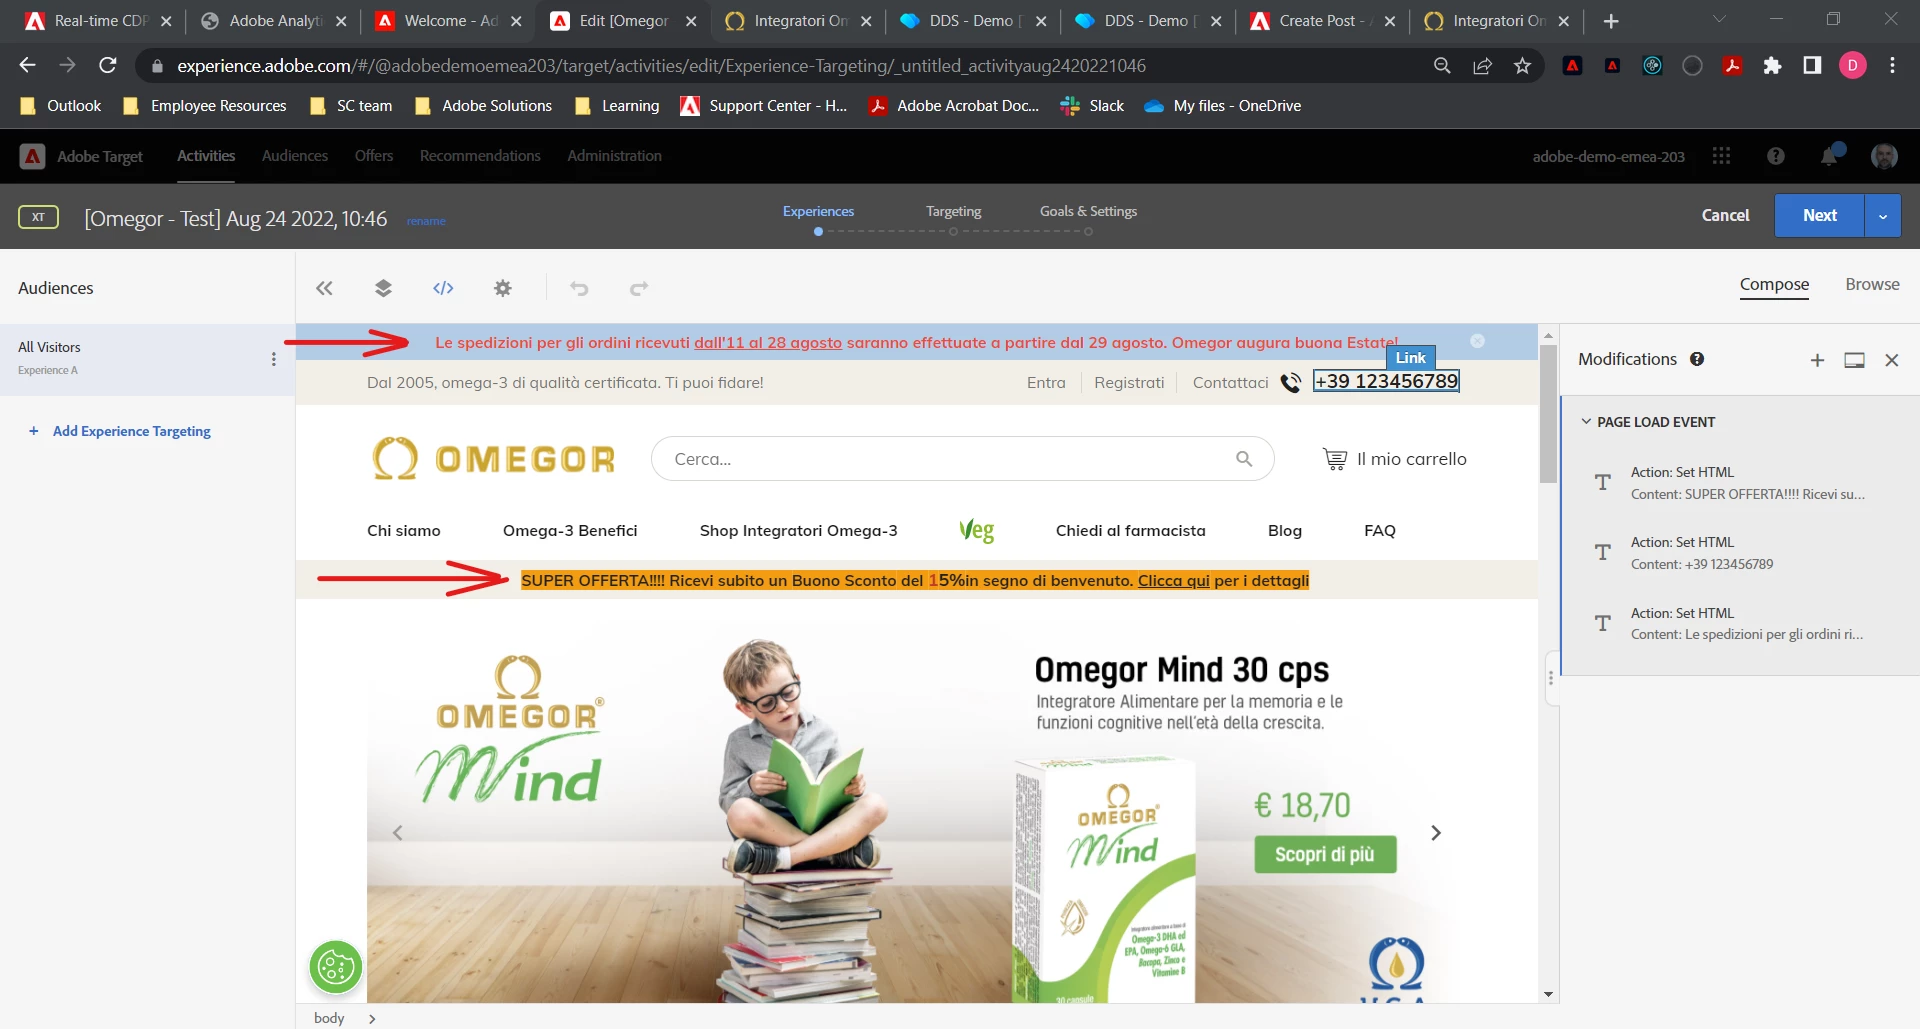
Hi everyone, I created a new activity on Target, to do some tests before a Demo I will have next week with a client
I used VEC Helper to ingest the target library, everything seems correct, but I don't see the experience on the client web site, this is the preview url: https://www.omegor.com/?at_preview_token=BZM0WVMjpE2YNEQh8tY3vocSfSwQT5b2B15RA4DwkXU&at_preview_inde...
Solved! Go to Solution.
@dave772 , Sorry my past comment got posted with incorrect ID. Reposting it with the correct account :
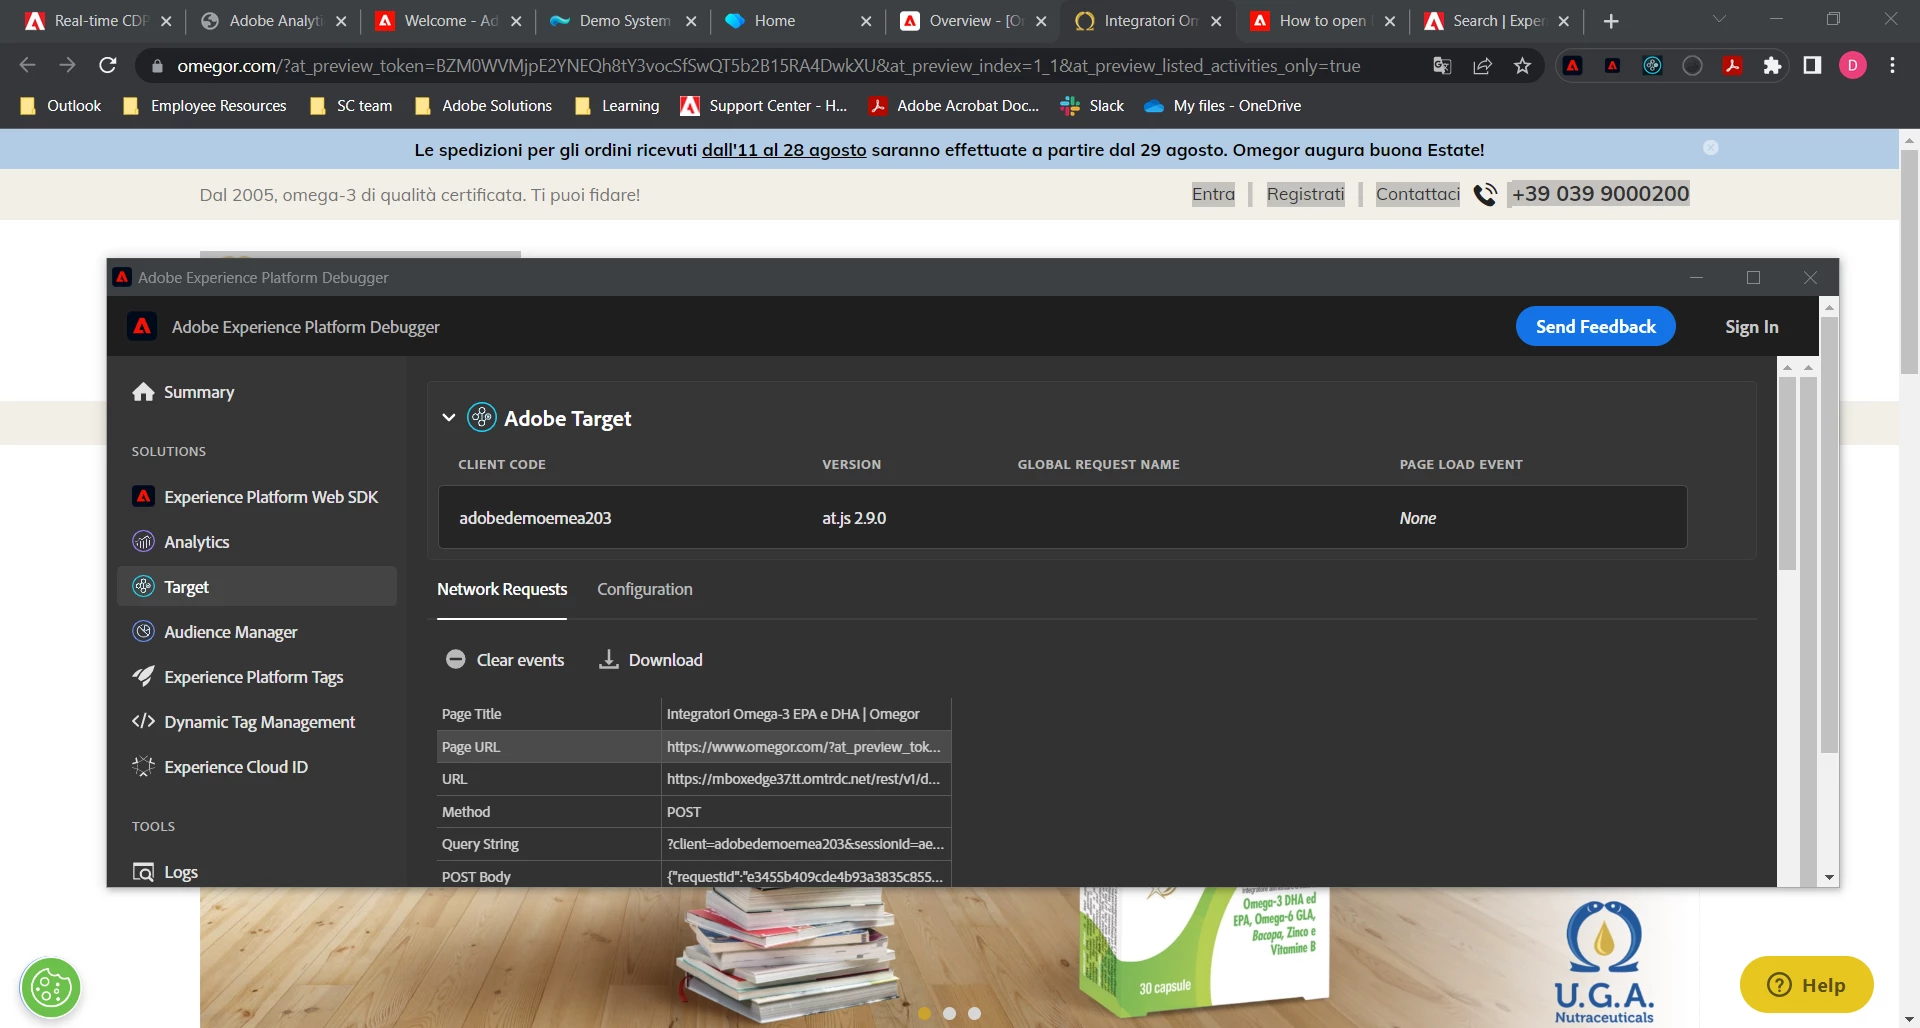
I tried accessing the QA URL on my end but was unable to see any Target call (delivery request) in the network calls.
QA URL's should show the expected results as you are using All visitors audience segment.
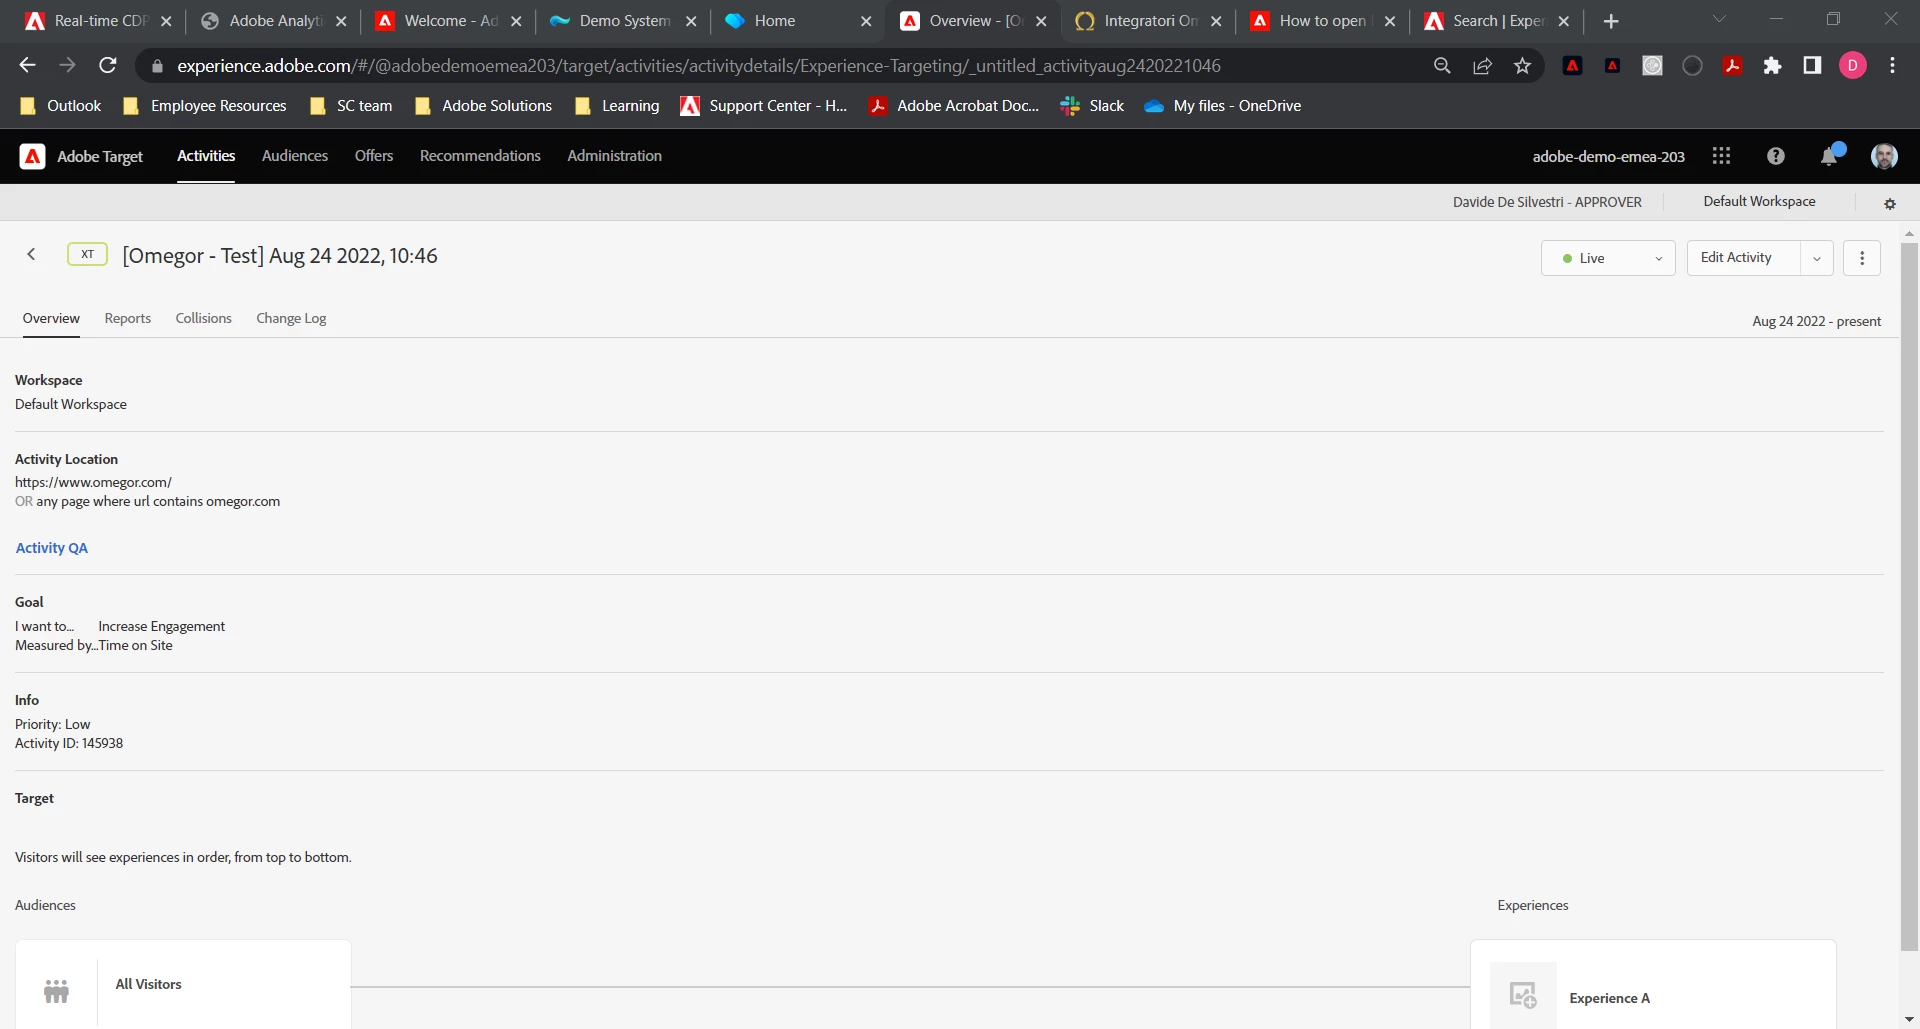
As per the screenshot it seems that the activity is already "Live" hence would recommend to try adding trace token on the page as described in this document : https://experienceleague.adobe.com/docs/target-learn/tutorials/troubleshooting/troubleshoot-with-tar... and then check for trace logs to look for exact reason of this behavior . You may also add "&mboxDebug=1" query parameter at the end of the pageURL (wth trace token) to check Adobe Target rendering status .
Hope this helps.
NA
Hi Alex, thanks for you answer.
@dave772 I tried accessing the QA URL on my end but was unable to see any Target call (delivery request) in the network calls.
About this, you are right, I used the VEC Help Composer Plugin to inject the library to the website.
I will check the link you provided, thanks.
Kind regards,
Davide
@dave772 , Sorry my past comment got posted with incorrect ID. Reposting it with the correct account :
I tried accessing the QA URL on my end but was unable to see any Target call (delivery request) in the network calls.
QA URL's should show the expected results as you are using All visitors audience segment.
As per the screenshot it seems that the activity is already "Live" hence would recommend to try adding trace token on the page as described in this document : https://experienceleague.adobe.com/docs/target-learn/tutorials/troubleshooting/troubleshoot-with-tar... and then check for trace logs to look for exact reason of this behavior . You may also add "&mboxDebug=1" query parameter at the end of the pageURL (wth trace token) to check Adobe Target rendering status .
Hope this helps.
Hi @Gaurav_Singh, I tried the link but the Debugger ha changed and I don't see those user information shown in the video (see the image). In this example, I am using a demo website, but still I don't visualize the experience I created: https://builder.adobedemo.com/run/ddesilvestri-XM3W?token=eyJhbGciOiJIUzI1NiIsInR5cCI6IkpXVCJ9.eyJpZ...
Views
Like
Replies
Views
Likes
Replies