Why I open 2 tabs of one website, the new version of debugger show them sepratelly?
Let me show you below. I do the same things for two debuggers, the new one and the old one. I just load a page in Tab 1 and load a page in Tab 2. Total 2 hit, then do nothing more.
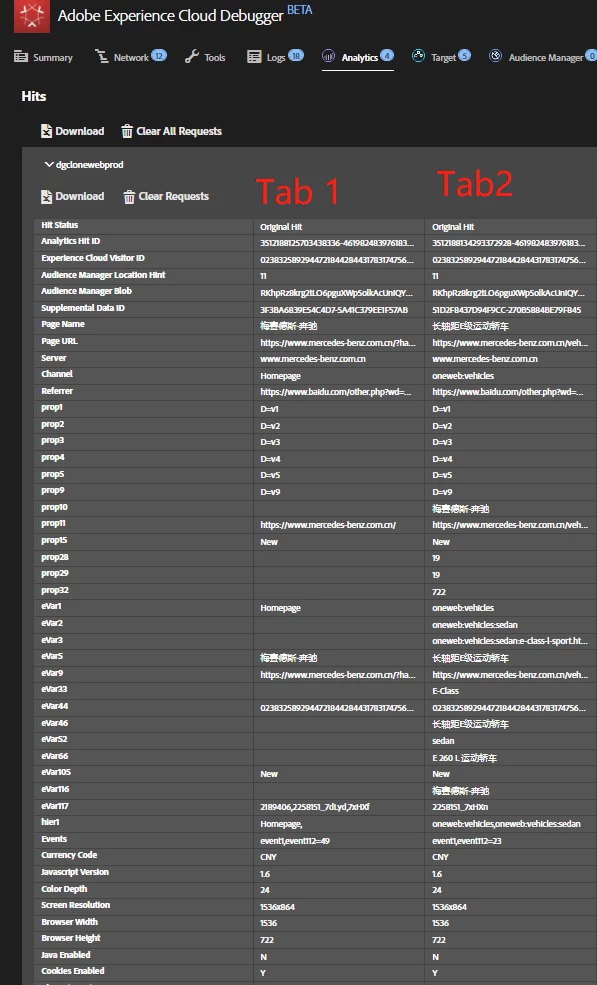
If I use the previous debugger,the Adobe Experience Cloud Debugger and open 2 tab of a same website, it will showed the total 2 hits in the same network requests window. Each tab got 1 hit. (That's correct)

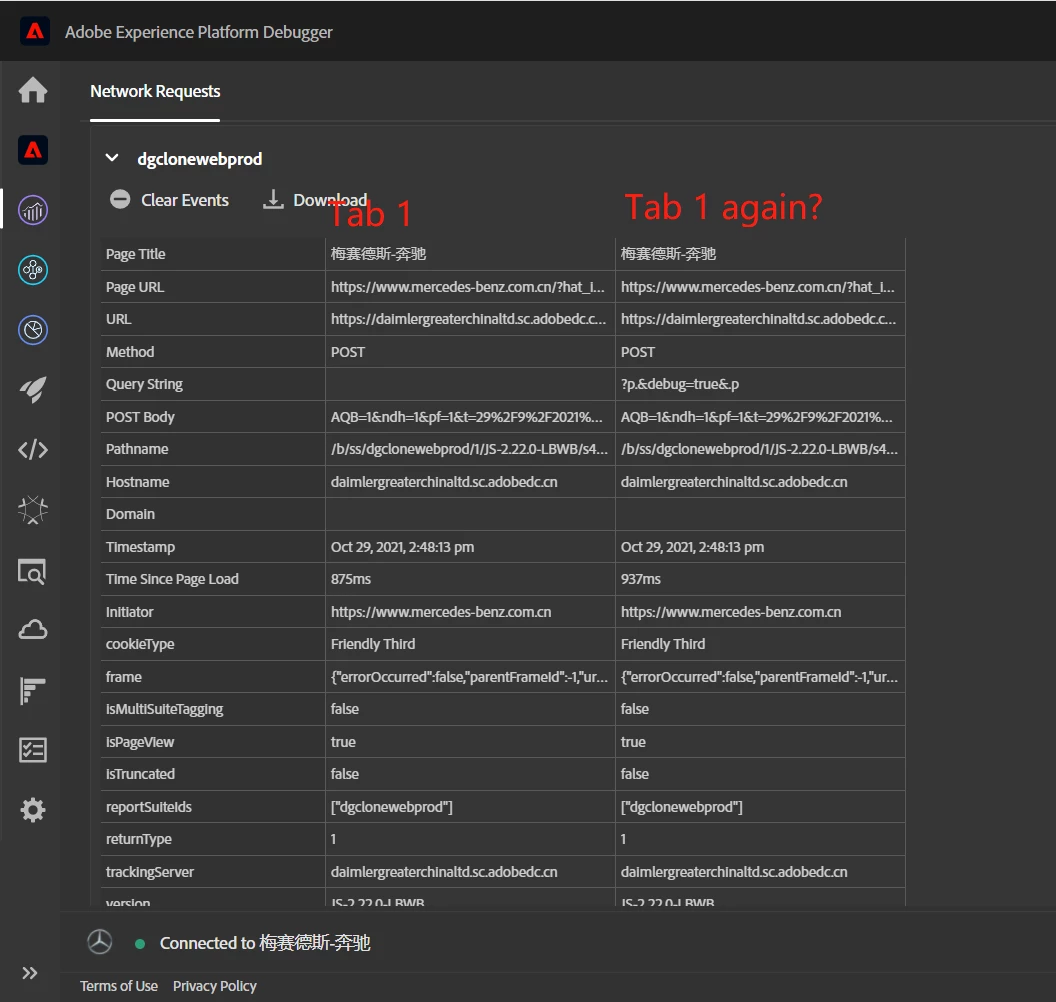
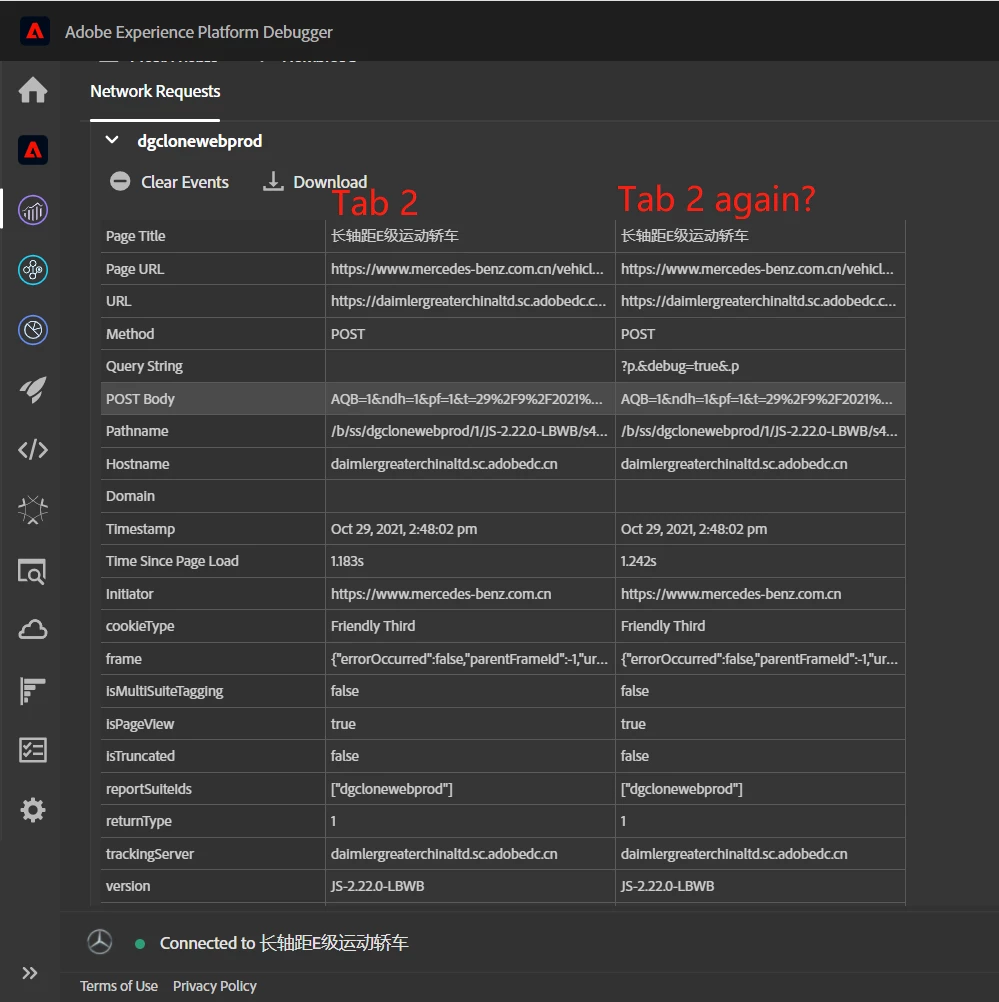
However, if I use the new debugger extension, the Adobe Experience Platform Debugger, it will only shows the servercall of 1 tab. And the data event dupilcat(showed 2 same hits servercall in for only 1 page view)?!
The Tab 1 will have a window/table, and the Tab 2 will have another window/table, they can not showed in the same window and also it totally showed 4 hits?!
My question is, how can I showed all tabs load in the same windows in the new debugger, cause the old debugger will stop it's service.
Question 2 is why it shows 2 hits for only 1 page load in 1 tab.
BR
Deb