Expand my Community achievements bar.

SOLVED

AEP debugger showing double calls on SPA dev site

Avatar

Level 1

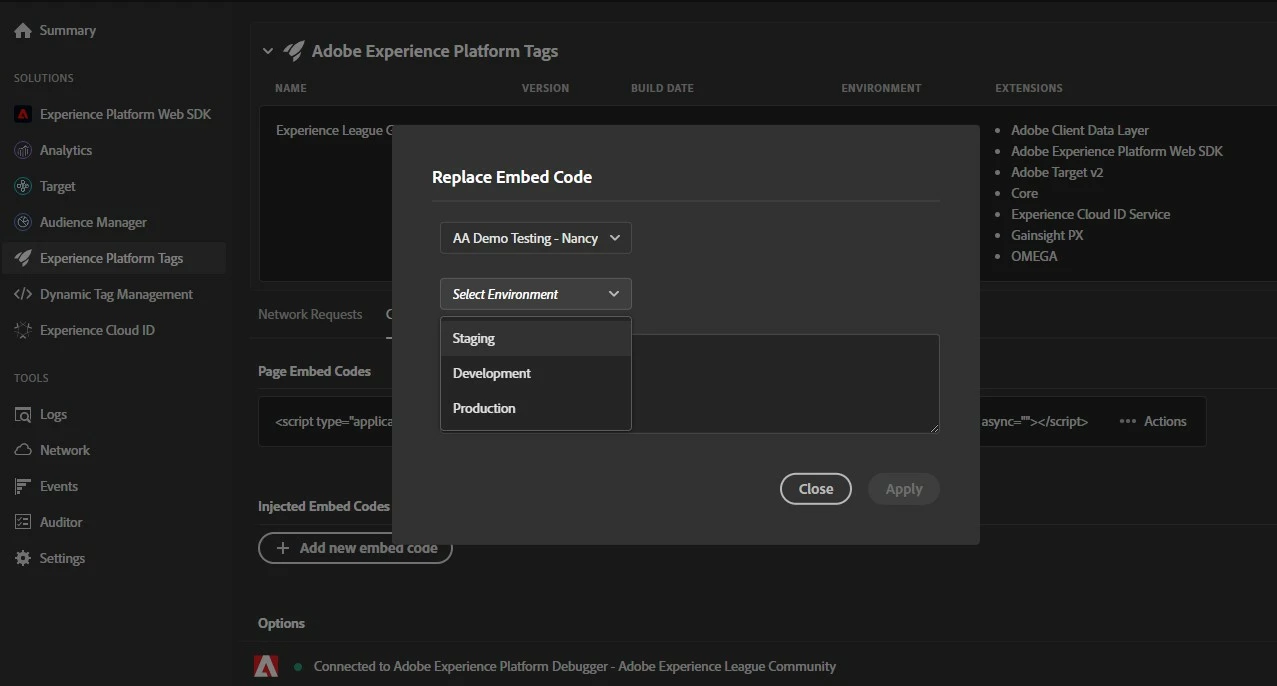
aep-question.jpg

Hello, I am using the AEP Debugger extension in Chrome, visiting a SPA dev site, using 'replace embed code' with a Launch/Tags dev library. I am seeing double calls for everything tracked, but my colleagues do not experience this. Is there something in the AEP Debugger settings I need to change? This is the only tool I have found that works for easily loading Launch libraries on this SPA site, so I really would like to get this working correctly. Thanks!

Topics

Topics help categorize Community content and increase your ability to discover relevant content.

1 Accepted Solution

Avatar

Correct answer by
Level 5

Seeing double calls for everything tracked can occur if the Adobe Experience Platform (AEP) Debugger extension is installed multiple times or if there are multiple instances of the extension running in the same browser window. Here are a few things you can try to resolve the issue:

  1. Disable other extensions: Try disabling other browser extensions to see if they are interfering with the AEP Debugger extension.

  2. Clear browser cache and cookies: Clear your browser's cache and cookies and try again.

  3. Check for multiple instances of the extension: Make sure there are no other instances of the AEP Debugger extension running in your browser. To do this, click on the three dots in the top right corner of your Chrome browser, select "More tools" and then "Extensions". Look for multiple instances of the AEP Debugger extension and remove any duplicates.

  4. Check Launch embed code: Make sure that the Launch embed code is only being loaded once on the page. Double-check that there are no other embed codes being loaded that could be causing the issue.

  5. Check SPA page transitions: It's possible that the issue is related to SPA page transitions. Check to see if the double calls only occur during specific page transitions or if they occur on every page.

If none of the above steps resolve the issue, you may want to try reaching out to Adobe's technical support for further assistance.
 

View solution in original post

1 Reply

Avatar

Correct answer by
Level 5

Seeing double calls for everything tracked can occur if the Adobe Experience Platform (AEP) Debugger extension is installed multiple times or if there are multiple instances of the extension running in the same browser window. Here are a few things you can try to resolve the issue:

  1. Disable other extensions: Try disabling other browser extensions to see if they are interfering with the AEP Debugger extension.

  2. Clear browser cache and cookies: Clear your browser's cache and cookies and try again.

  3. Check for multiple instances of the extension: Make sure there are no other instances of the AEP Debugger extension running in your browser. To do this, click on the three dots in the top right corner of your Chrome browser, select "More tools" and then "Extensions". Look for multiple instances of the AEP Debugger extension and remove any duplicates.

  4. Check Launch embed code: Make sure that the Launch embed code is only being loaded once on the page. Double-check that there are no other embed codes being loaded that could be causing the issue.

  5. Check SPA page transitions: It's possible that the issue is related to SPA page transitions. Check to see if the double calls only occur during specific page transitions or if they occur on every page.

If none of the above steps resolve the issue, you may want to try reaching out to Adobe's technical support for further assistance.