
Harnessing Data Distiller's Query Pro Mode for Chart Authoring from Datasets in Adobe Experience Platform
Welcome to a guide on utilizing Data Distiller's Query Pro Mode for creating dynamic charts and dashboards directly from datasets within the Adobe Experience Platform. This feature is essential for users aiming to convert raw data into visually impactful and actionable insights.
Step 1: Initialize Your Insights Data Model
To effectively visualize your data, begin by setting up a robust data structure:
- Create a Database: Start with naming your database datasetanalysis.
- Define a Schema: Proceed by establishing a schema titled datasetanalysismodel.
- Name Your Data Model: Identify your model clearly with datasetanalysisinsights for easy referencing in dashboards.
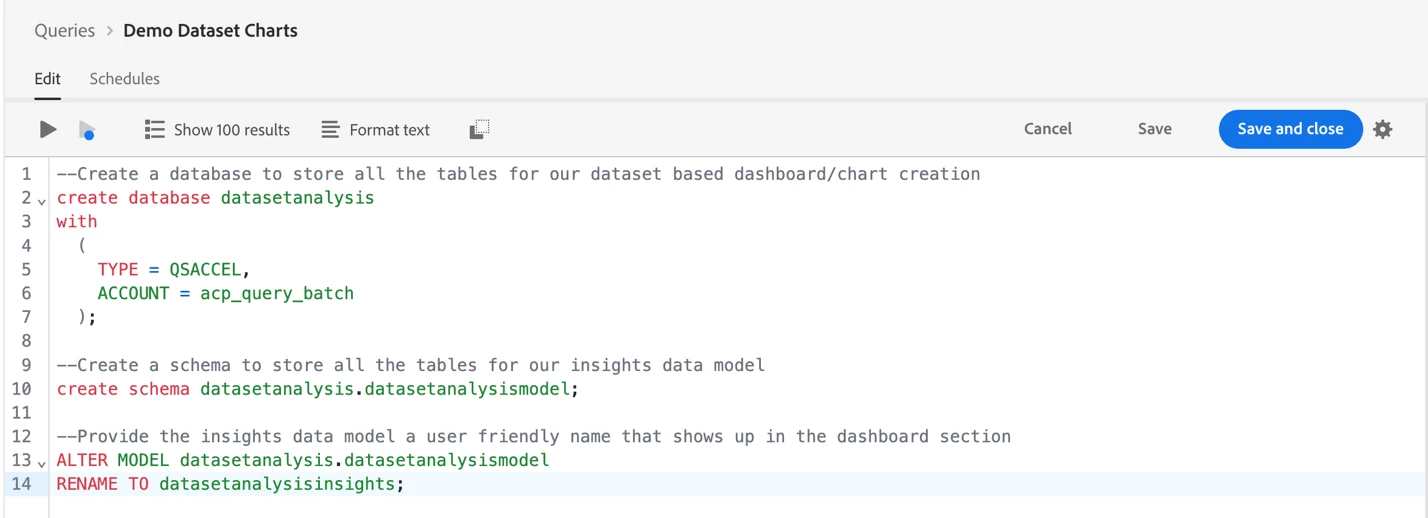
--Create a database to store all the tables for our dataset based dashboard/chart creation
create database datasetanalysis
with
  (
    TYPE = QSACCEL,
    ACCOUNT = acp_query_batch
  );

--Create a schema to store all the tables for our insights data model
create schema datasetanalysis.datasetanalysismodel;

--Provide the insights data model a user friendly name that shows up in the dashboard section
ALTER MODEL datasetanalysis.datasetanalysismodel
RENAME TO datasetanalysisinsights;
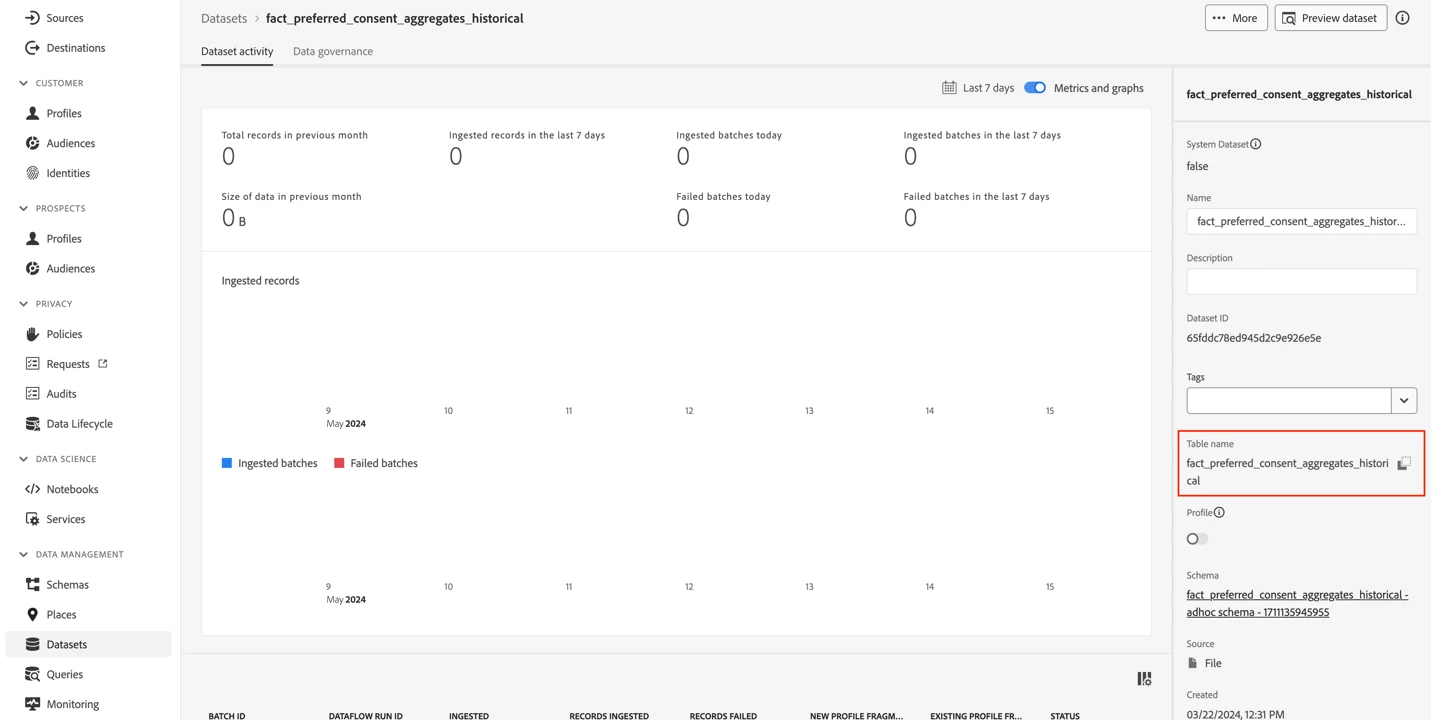
Step 2: Select Your Dataset
Identify and choose the dataset you wish to analyze within Adobe Experience Platform. Note the table name and optionally preview if required.
Step 3: Craft Your SQL Query
Formulate a SQL query to extract the desired data:
- Focus on Data Management: Employ aggregation or bucketing in your SQL to streamline data handling, avoiding the pitfalls of dealing with raw, profile-level data.
- Data Refresh Strategy: Assuming a daily data refresh for demonstration, you might opt to regularly drop and recreate your table. Alternatively, you could insert new records based on dates to keep the dataset current. For this demo I have used Anonymous block to drop, create, and insert on a daily basis.
- Automate Query Execution: Set your query to run at predetermined intervals to maintain up-to-date data using Scheduled Queries
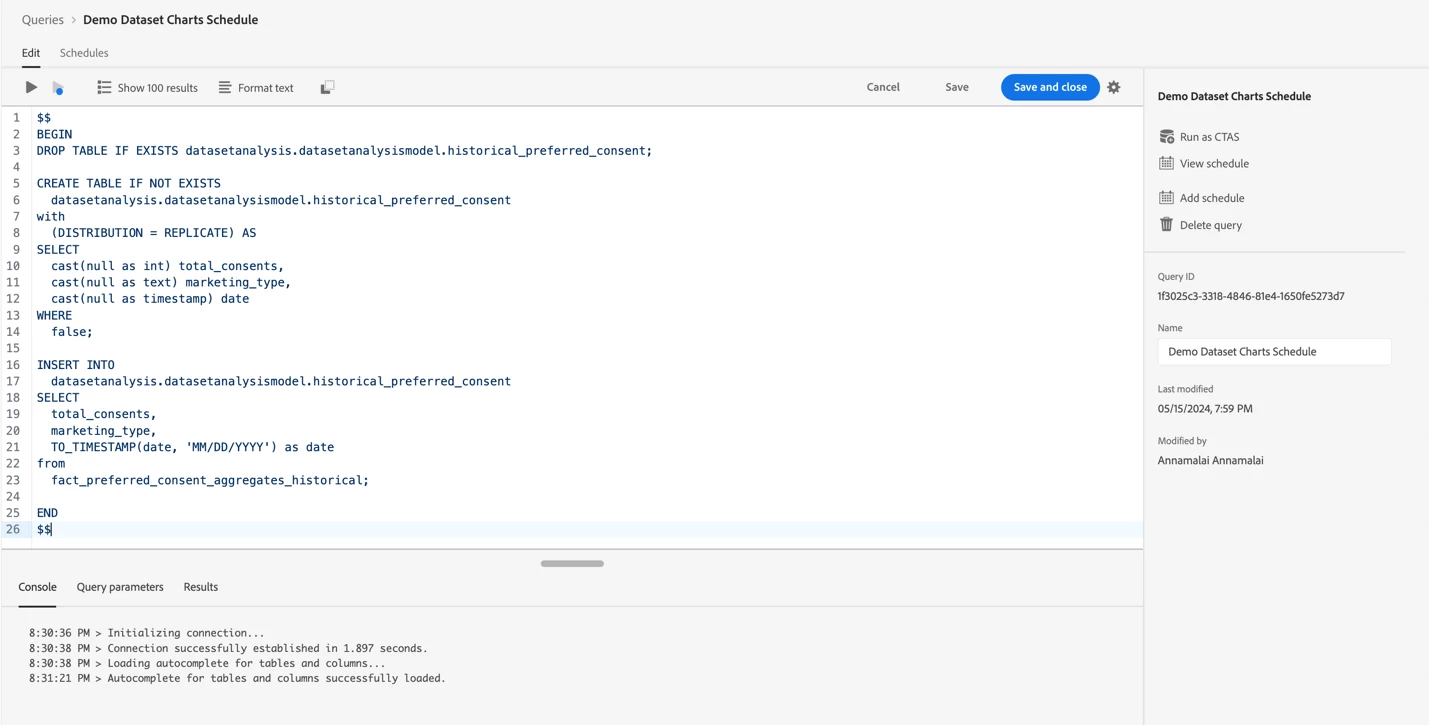
$$
BEGIN
DROP TABLE IF EXISTS datasetanalysis.datasetanalysismodel.historical_preferred_consent;

CREATE TABLE IF NOT EXISTS
  datasetanalysis.datasetanalysismodel.historical_preferred_consent
with
  (DISTRIBUTION = REPLICATE) AS
SELECT
  cast(null as int) total_consents,
  cast(null as text) marketing_type,
  cast(null as timestamp) date
WHERE
  false;

INSERT INTO
  datasetanalysis.datasetanalysismodel.historical_preferred_consent
SELECT
  total_consents,
  marketing_type,
  TO_TIMESTAMP(date, 'MM/DD/YYYY') as date
from
  fact_preferred_consent_aggregates_historical;

END
$$
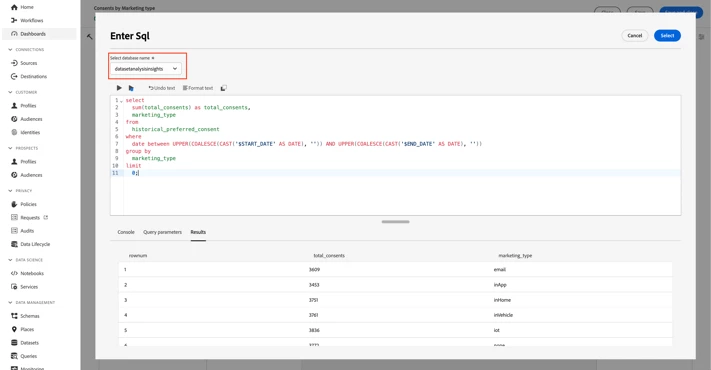
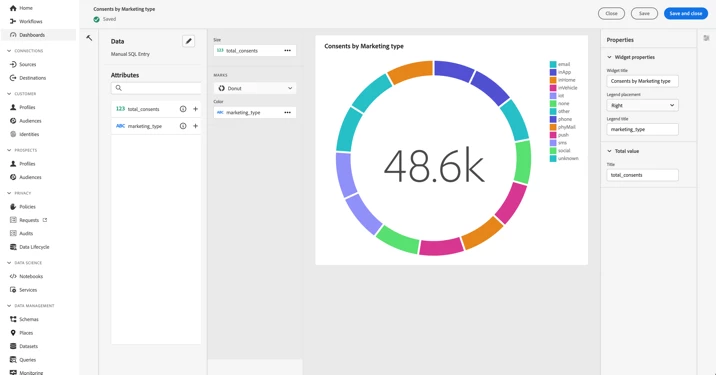
Step 4: Develop Your Charts and Dashboards
With your data prepared, engage Data Distiller’s Query Pro Mode to start authoring your charts and dashboards:
- Utilize Query Pro Mode: Use the advanced capabilities of Query Pro Mode in Data Distiller to access and visualize the data stored in the Accelerated store.
- Choose Visualization Types: Select from various visualization types that best depict your data, effectively uncovering trends and insights.
For a detailed walkthrough on creating these visualizations, refer to the video demonstration in my previous blog Introducing Enhanced Dashboard Capabilities in Data Distiller: Query Pro Mode.
This guide underscores how Data Distiller’s Query Pro Mode can be effectively leveraged to author charts from datasets in Adobe Experience Platform, providing powerful tools for comprehensive data analysis and visualization. Explore your datasets and start creating insightful and compelling charts for your business use cases.
Author: @annamalai