Memory leak: CMS Old Gen Heap Issue | Community
Skip to main content
sandeepm744005
Level 5
June 4, 2020

Memory leak: CMS Old Gen Heap Issue

  • June 4, 2020
  • 4 replies
  • 14343 views

Hello,

Environment - AEM 6.4.8


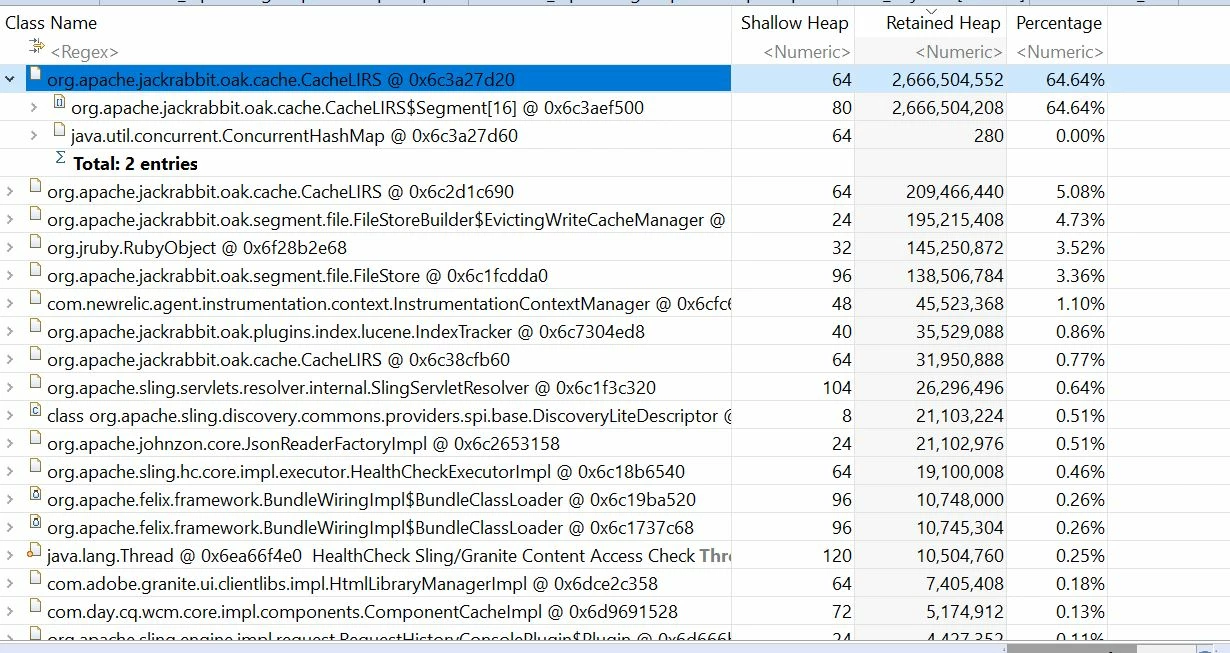
Facing frequently CMS Old Gen Heap Issue in production publishers. By reading through the HeapDumps, it is always pointing to CacheLIRS which is taking around 65% of the space and causing issues. 


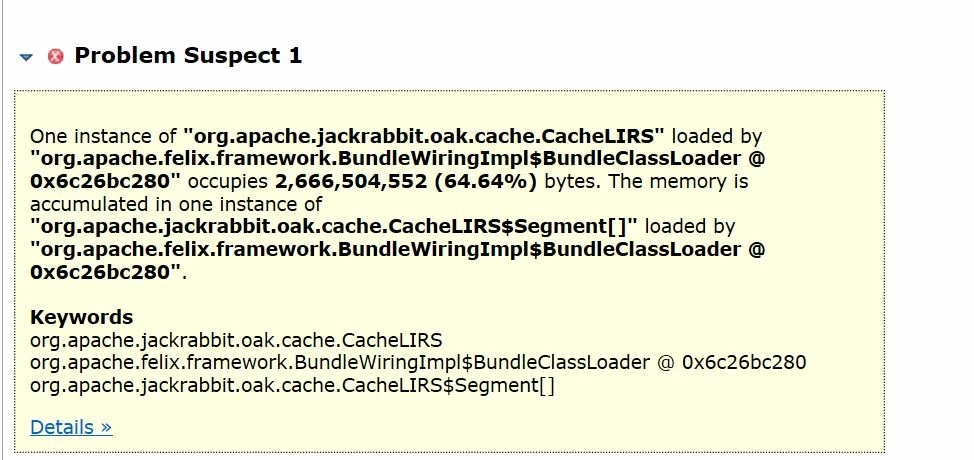
One instance of "org.apache.jackrabbit.oak.cache.CacheLIRS" loaded by "org.apache.felix.framework.BundleWiringImpl$BundleClassLoader @ 0x6c26bc280" occupies 2,666,504,552 (64.64%) bytes. The memory is accumulated in one instance of "org.apache.jackrabbit.oak.cache.CacheLIRS$Segment[]" loaded by "org.apache.felix.framework.BundleWiringImpl$BundleClassLoader @ 0x6c26bc280".


Keywords

org.apache.jackrabbit.oak.cache.CacheLIRS

org.apache.felix.framework.BundleWiringImpl$BundleClassLoader @ 0x6c26bc280

org.apache.jackrabbit.oak.cache.CacheLIRS$Segment[]


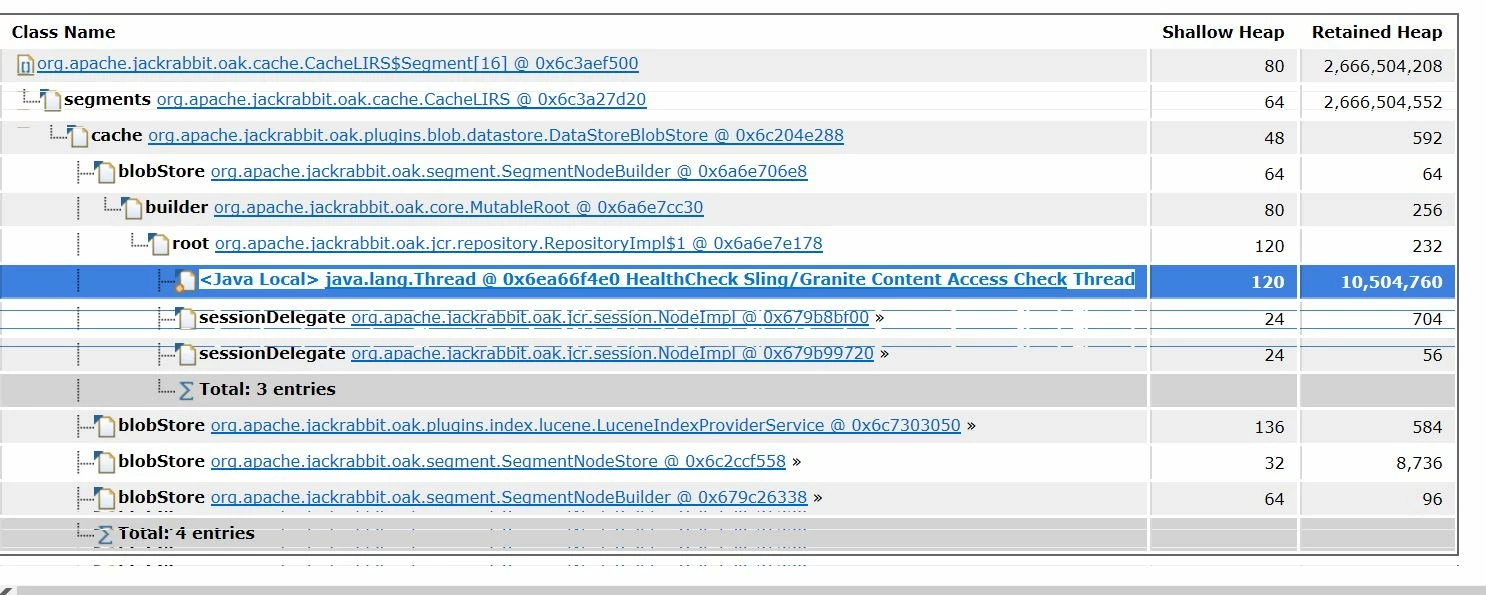
HeapDumps & thread-dumps are pointing towards the below thread. 


  •    <Java Local> java.lang.Thread @ 0x6ea66f4e0 HealthCheck Sling/Granite Content Access Check Thread

Do we require the HealthChecks monitoring dashboard in Production Publishers? there are other agents like NewRelic are already installed. 


This post is no longer active and is closed to new replies. Need help? Start a new post to ask your question.

4 replies

Adobe Employee
June 4, 2020

org.apache.jackrabbit.oak.cache.CacheLIRS - is not an issue at all.

I suggest opening a support case and share thread & heap dump along with log files

sandeepm744005
Level 5
June 4, 2020

Thanks for your reply. Adobe Support Case has already been created for this issue, I thought of checking some of the experts opinion in this thread if there are any other pointers in terms of fixing the issue.

Adobe Employee
June 4, 2020
If you aren't, please ensure AEM is running with at least these 4 JVM flags : 
-XX:+PrintGCApplicationStoppedTime -XX:+PrintGCDateStamps -XX:+PrintGCDetails -XX:+PrintGCTimeStamps
 
Which will have Java write some GC information to disk :
gc.log, gc.log.1, gc.log.8.current etc
 
Provide those logs if you have them to the case you raised.
joerghoh
Adobe Employee
Adobe Employee
June 6, 2020

Hi,


I am not totally sure if that's a normal behavior. Can you check in /system/console/jmx if the number of "SessionStatistics" entries is growing over time. In that case you have a session leak, which often goes together with memory issues like you described.

arturl43391132
Level 4
September 1, 2020

Hello @joerghoh,

Could you please explain what do you mean by "he number of "SessionStatistics" entries is growing over time"? Now I've checked our number and it is 104. If it will increase in some hours, can it be session leak?


Thanks.

Adobe Employee
September 1, 2020

104 is fine.


This generally is not of concern until the jcr-session count goes into the thousands.

April 27, 2021

Did you get any solution for this?

gaurav_s_tadigi
November 11, 2021

@sandeepm744005 Were you guys able to determine the root cause for this issue? Any pointers you would like to share with us? We are also having the same heap dump leak suspects that you have mentioned above.