Memory leak Analysis: Heap dump pointing to internal framework classes | Community
Skip to main content
Level 4
May 27, 2022

Memory leak Analysis: Heap dump pointing to internal framework classes

  • May 27, 2022
  • 1 reply
  • 1355 views

Hello There,


There is a problem in the application where the heap is becoming full slowly overtime and leading to outofmemory exception. 

From the heap dump analysis I only see the internal class from OAK Tar.

Please see the below screenshots

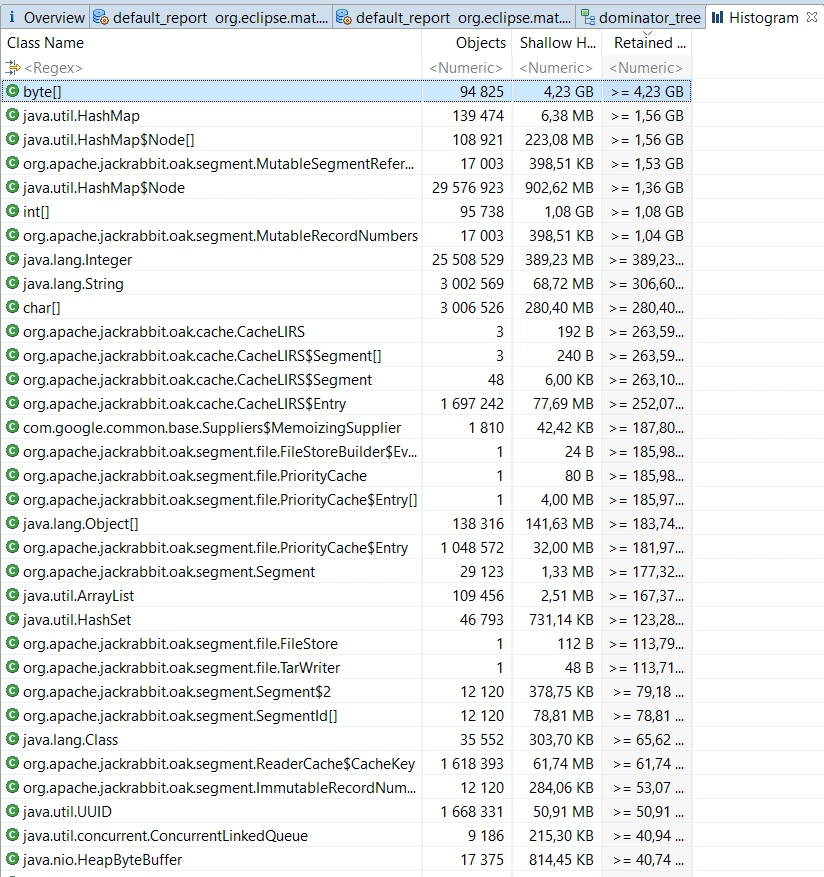
Histogram(by retained size)
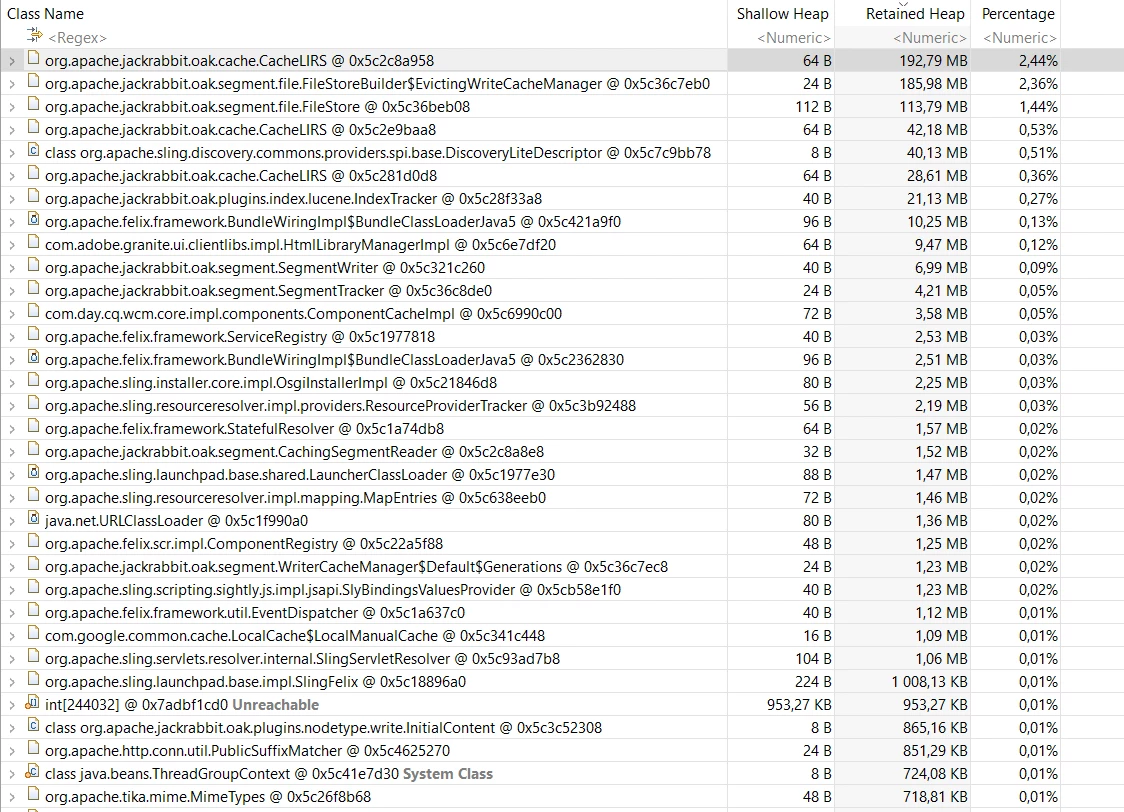
Dominator tree


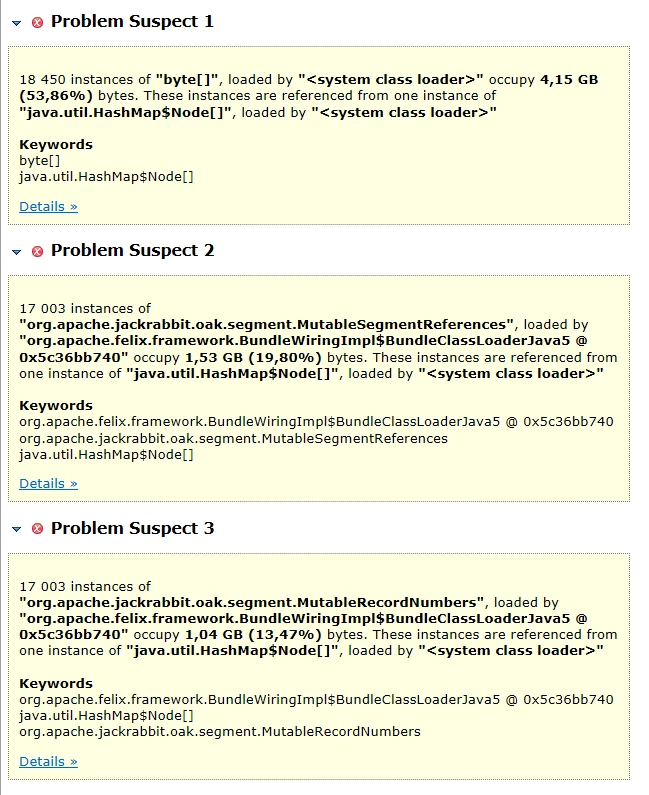
Problem Suspects reported by eclipse MAT

Could someone direct me as to where the problem could be ?

This post is no longer active and is closed to new replies. Need help? Start a new post to ask your question.

1 reply

Anmol_Bhardwaj
Community Advisor
Community Advisor
May 27, 2022

Increase in heap size in mostly caused by more and more live objects being not closed or collected by gabage collector.


I would suggest you check the running thread count for 1-2 hours in your AEM instance.

<server>/system/console/profiler.

Let it run for 1-2 hours, and it will give you a pretty clear idea on which threads are longest in runnable.


For the heap dump analysis, start with the heaps with the longest stack trace. It would most often point to something in the custom code. Once you fine the line of code responsible it should be pretty easy to fix it.

Level 4
May 27, 2022

Hi @anmol_bhardwaj ,
Thank you, I will try out the profiler and see if it does provide any leads into the actual cause.


However, regarding diving deep into the stacks, I did path to GC root on some of these top contributing classes and it doesn't point me to a custom class. Also the top contributing objects are OAK ones, which are not usually referenced in the custom classes.

Anmol_Bhardwaj
Community Advisor
Community Advisor
May 27, 2022

Could be a product issue as well,due to some patch installation not happening properly.

Is it just hapenning in a single server or all of them?

You will get more clarity with profiler dumps. If you don't see a large percentage of custom code threads, you can open a support ticket for the same.