How to monitor Adobe experience manager? Please suggest any tools like Splunk, Dynatrace, Solarwinds,etc..
Solved! Go to Solution.
Views
Replies
Total Likes
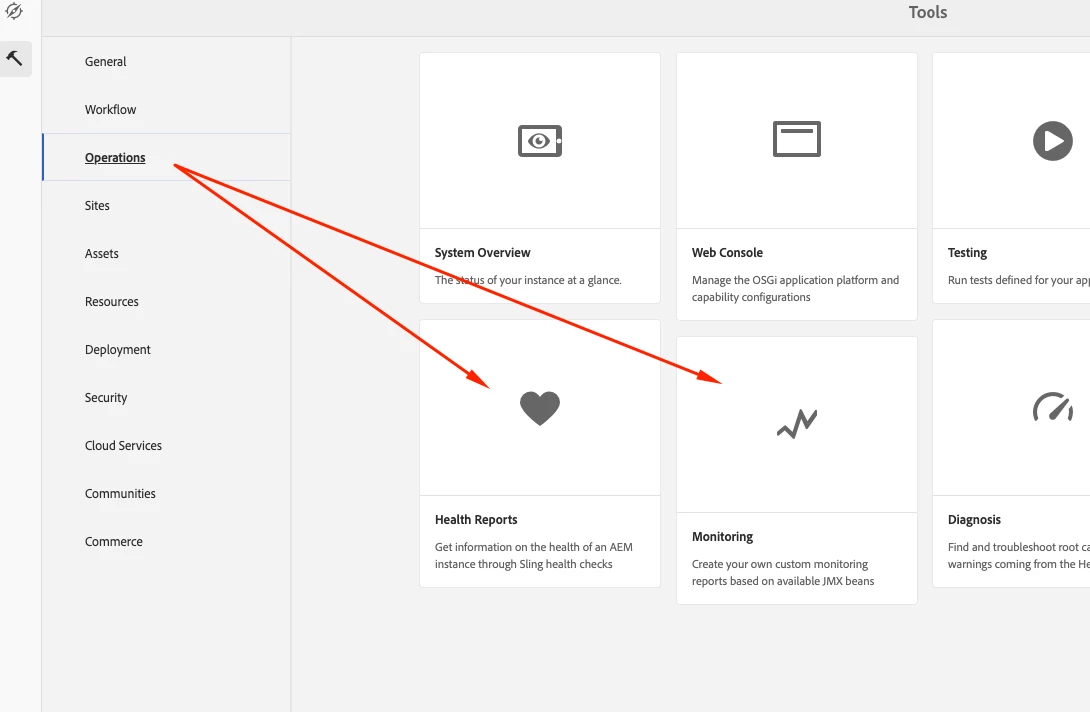
AEM on-prem has a lot of ob built-in tools that allow successful monitoring while using the product.
Health reports are gathering information on an AEM instance through Sling health checks and allow a custom dashboard deployment.
You can even take advantage of an OOTB Monitoring Charts
Hi @Ramanan1 ,
AEM OOTB provides operational dashboard to monitor the instance and health check steps.
This should be monitored frequently and fix the reported problem.
You can navigate by AEM>tools>tools
Along with the above suggest you to monitor and perform maintenance activities which should be carried out to keep your instance in good condition.
Below article explain it in detail.
After considering above points, we can integrate the instance with tools like Dynatrace or splunk.
I feel Dynatrace is a better option to go. As splunks as lots of limitation compare to Dynatrace such as sunthetic transaction, db monitoring, application level code monitoring.
You can go through the below article to know the difference between tools.
https://answers.dynatrace.com/questions/228981/dynatrace-vs-splunk-1.html
Views
Replies
Total Likes
AEM on-prem has a lot of ob built-in tools that allow successful monitoring while using the product.
Health reports are gathering information on an AEM instance through Sling health checks and allow a custom dashboard deployment.
You can even take advantage of an OOTB Monitoring Charts
Views
Replies
Total Likes
Views
Replies
Total Likes
Views
Replies
Total Likes
If you want to use third-party monitoring apps, I would recommend either using New Relic Or App Dynamics. I have worked with both and very easy to install.
[2] https://docs.appdynamics.com/display/PRO45/Install+the+Java+Agent
Views
Replies
Total Likes
Hi @Ramanan1,
Regarding the monitoring tools, there is an integrated profiler into AEM, but it will only be usable for a "short" period of time, to take a snapshot of a very specific time-range when experiencing some performance issue.
You can find it in the Felix Web console > http://<host:port>/system/console/profiler
To have long-running monitoring, you can use any available Java APM (Application Performance Monitoring) tool.
The top most commonly used tools for that are:
~ New Relic
~ AppDynamics
~ Dynatrace
~ Introscope
These tools would monitor the instance in background automatically, but if you want to monitor some action periodically, you could use a simple profiler like:
~ JProfiler
~ VisualVM
I would recommend VisualVM as it is already integrated into the JDK, so no need to install a third party tool on your instance.
Also memory monitoring aspect only, you can enable the GC logs already. This is requiring to add some parameters to the jvm command line for starting AEM:
-XX:+PrintGC -XX:+PrintGCDetails -XX:+PrintGCTimeStamps -Xloggc:gclog.log
You can specify a different path/filename using the "-Xloggc" parameter.
Thanks!!
Views
Replies
Total Likes
Views
Likes
Replies
Views
Likes
Replies