Hi,
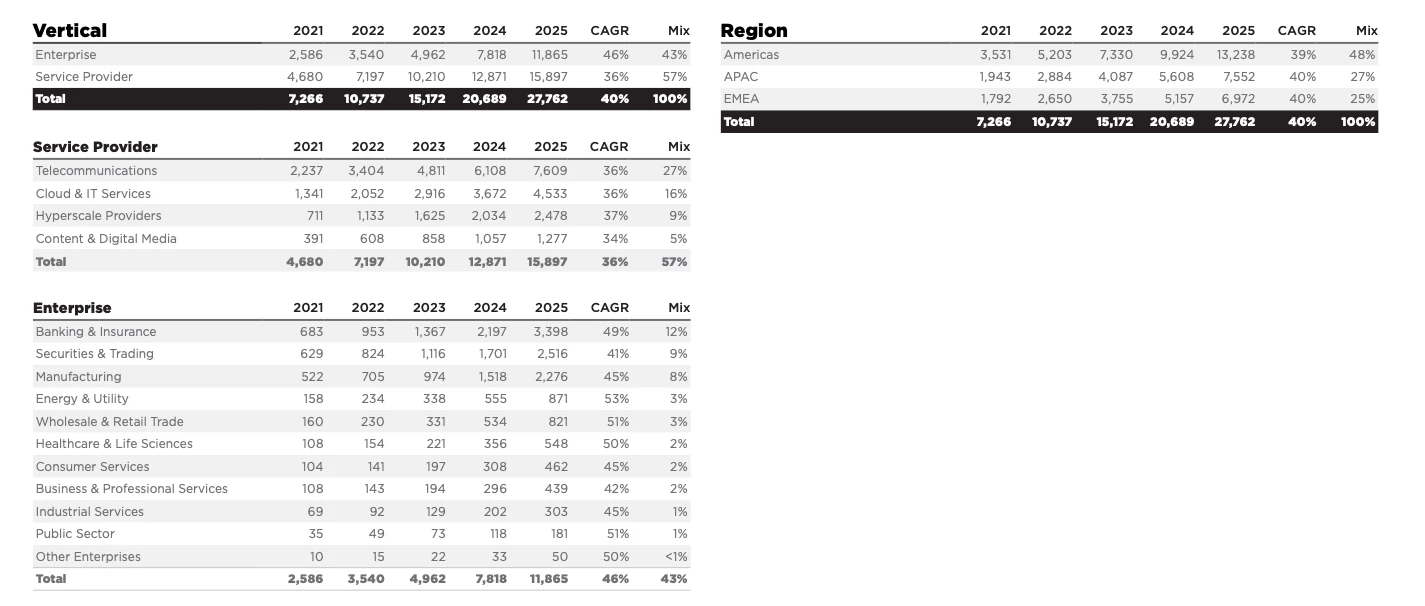
I have a usecase where our authors have data in a spread sheet. Gave some sample data below. Wondering what are some of the ways content authors can manage this data easily and then out of the box options to render graphs and charts in AEM.
I am planning to use React and https://www.chartjs.org/ to render the data if there is no out of the box component but I am not sure what is the best way authors can manage all the raw data for the charts. Any ideas with some reference documentation are greatly appreciated
Sample Data:
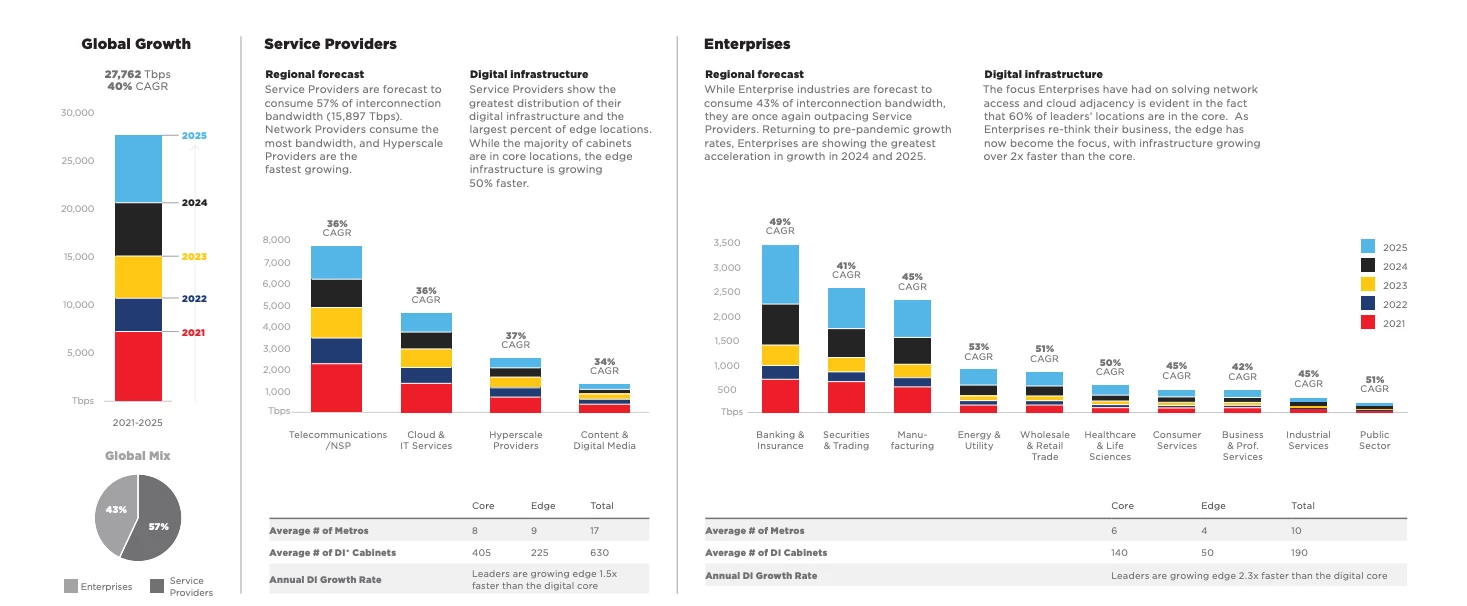
Example of graphs and charts to be displayed
Solved! Go to Solution.
@bpeddapudi not sure of what kind of deployment topology u r using, but if you are on AEM AMS and AEMCS, you work with Adobe CS and get access to Franklin aka Adobe Next Gen Compatibility where content authors can store/manage Google sheets in their favorite Google drives or Microsoft SharePoint, utilize powerful Adobe delivery feature to transform it as json and then you can develop react apps to display charts or any other display features by consuming json.
Awesome.... Going through the youtube link you shared.
@Shashi_Mulugu , I am trying to find some documentation which explains the details of how to connect google sheets to AEM. Can you provide me any links please. I tried googling but didn't find relevant results.
Views
Likes
Replies