AEM Publish Memory Usage vs System Monitoring Report - High Heap Memory Utilization
Hi AEM Community,
I am trying to figure out the reason for high heap memory utilization.
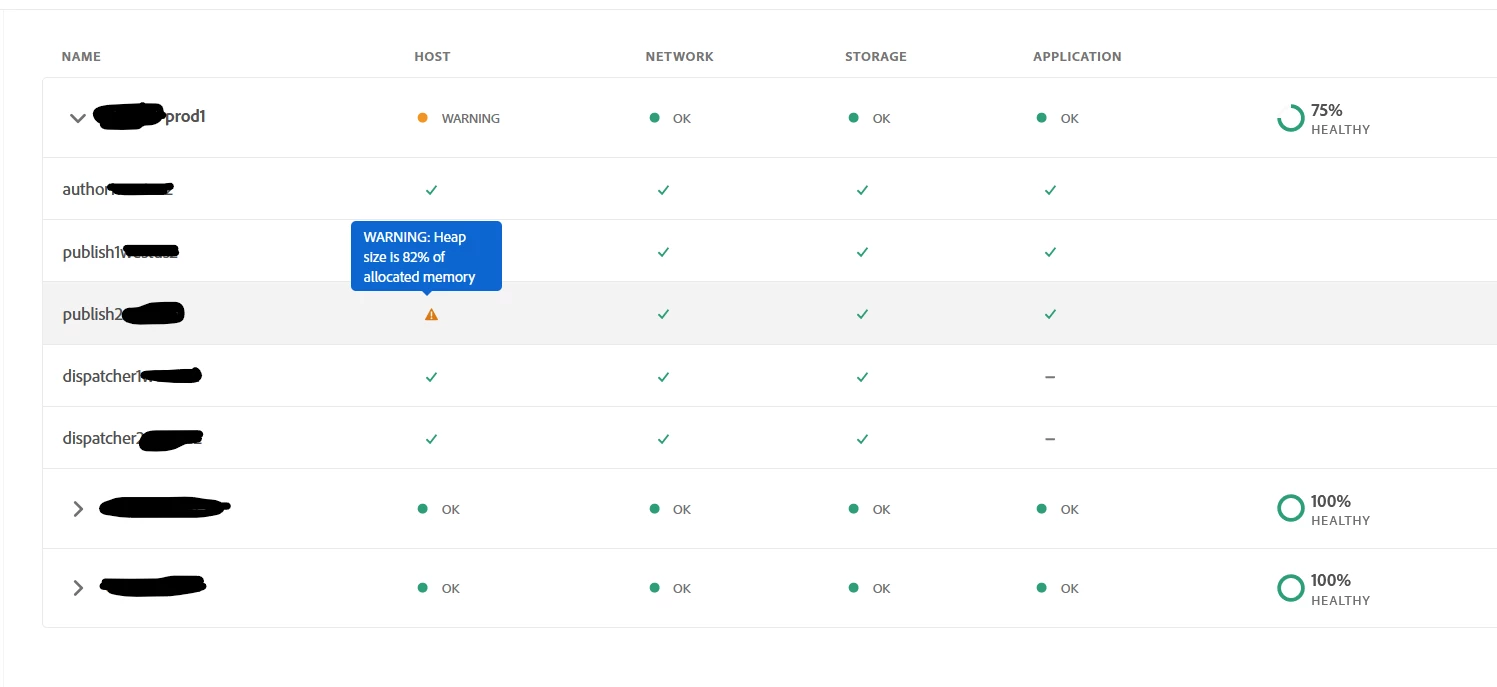
When navigating to the Reports -> System Monitoring, we see the below warning -
One of the publish server has high heap size which is 82% of the allocated memory.

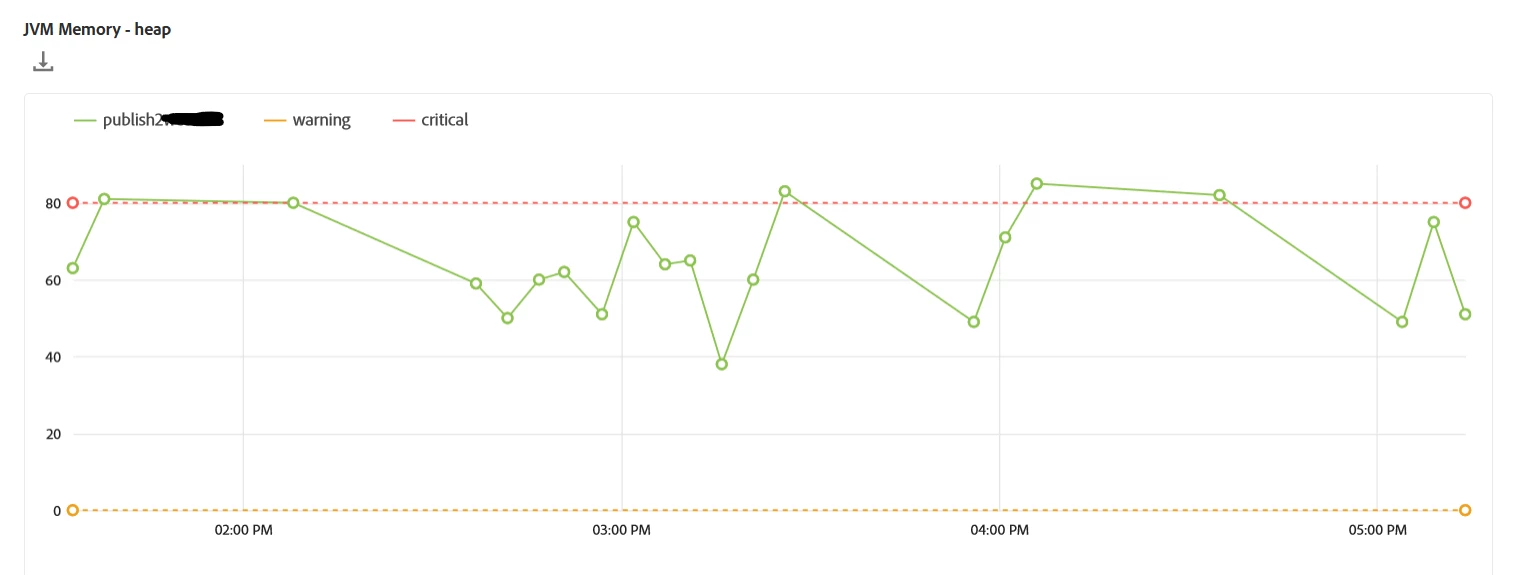
Checking the publish server's JVM Memory (Heap) we see the below -

Checking the same publish instance's memory usage at /system/console/memoryusage, we see the below stat -

The overall heap memory usage as per the above table is as following -
init = 4.29 Gb
used = 2.09 Gb
committed = 4.08 Gb
max = 4.08 Gb
If the above stat is true then the used heap memory is slightly less than 50% and not the 82% as displayed in the warning.
Am I reading these two stats correctly or is there something I am missing?
@arunpatidar, @estebanbustamante, @joerghoh, @aanchal-sikka
We are still combing through our error logs, heap dump and thread logs to figure out what's causing the spike.
Thanks in advance,
Rohan Garg

