Visualizing AEMaaCS Logs with Splunk

Visualizing AEMaaCS Logs with Splunk
by @daniel-strmeckiOverview
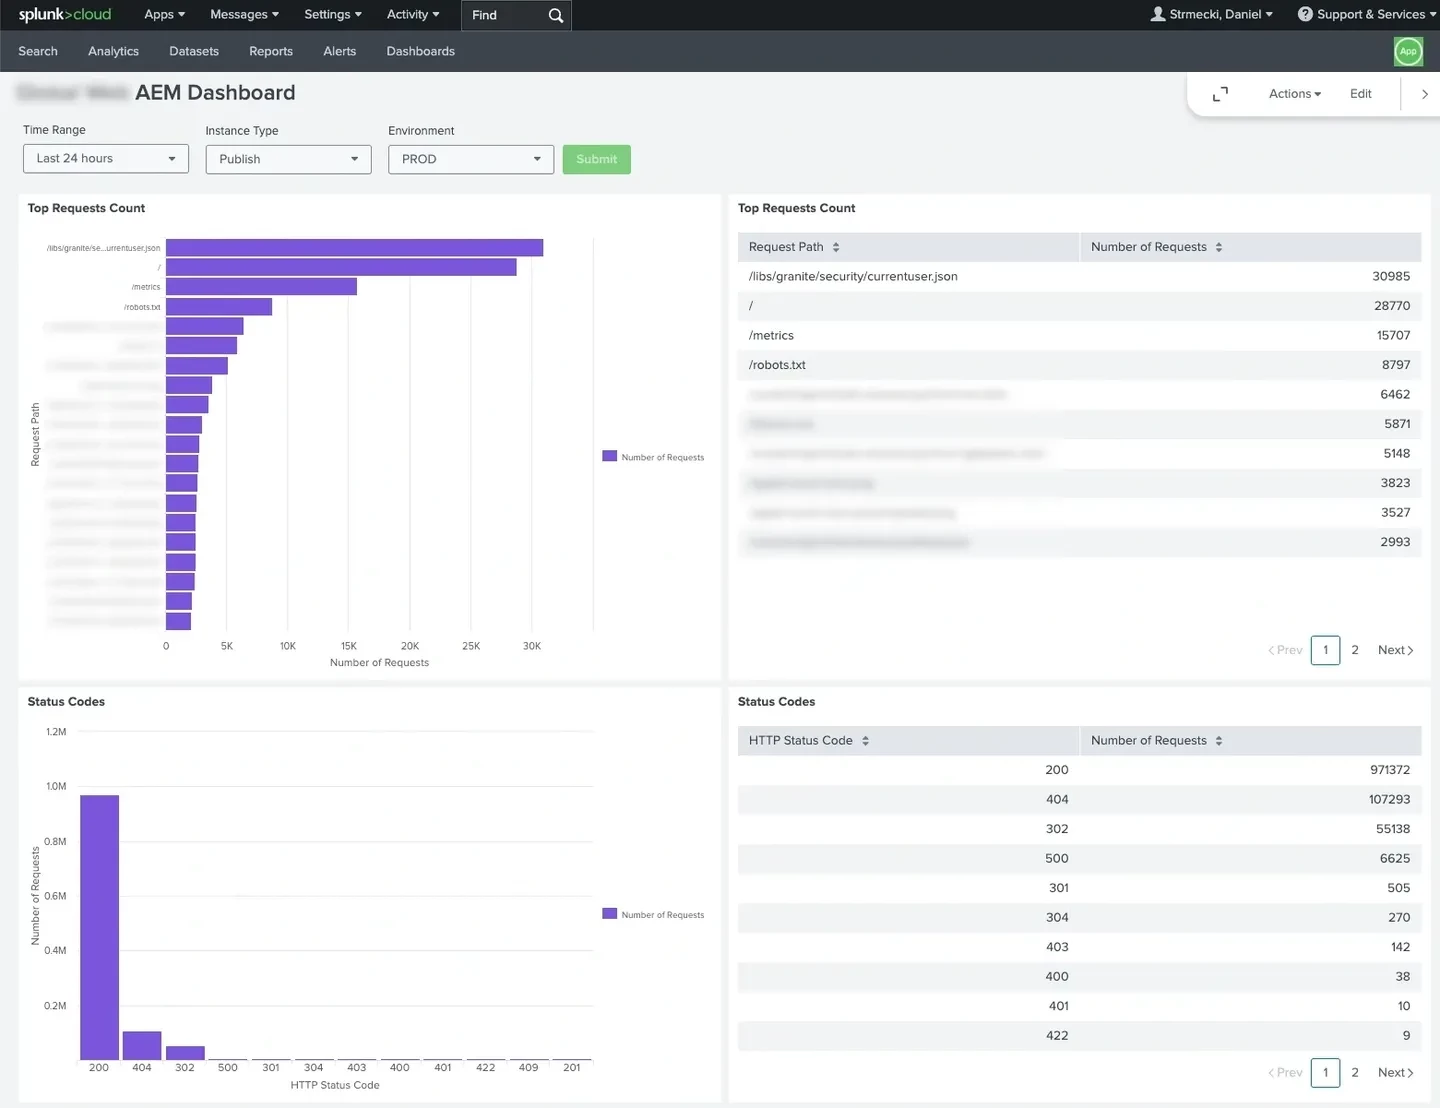
AEMaaCS customers and development teams with Splunk accounts can have their AEMaaCS logs forwarded to a designated Splunk index. The log data is the same as what's available via Cloud Manager downloads, but Splunk’s query features may offer added convenience. The ability to query logs is great for debugging specific issues, but Splunk can offer us more in terms of observability and alerting. In this article, we'll walk through setting up a dashboard for monitoring AEM. We'll be sharing some useful Splunk queries that can be easily reused for creating dashboards and reports. Splunk reports can be scheduled for delivery to the development teams via email or Slack to identify and fix issues as soon as possible, ideally even before users report them.
Key points:
- Learn how to create a dashboard in Splunk for monitoring AEMaaCS instances
- Visualize most common errors appearing in our AEM error logs
- Visualize number of requests that received a specific HTTP response code
- Visualize paths that receive the highest number of requests
- Visualize paths with the slowest response times
- Identify to most important issues and address them in small steps/iterations
Full Article
Read the full article on https://meticulous.digital/blog/f/visualizing-aemaacs-logs-with-splunk to find our more.
Q&A
Please use this thread to ask questions relating to this article

