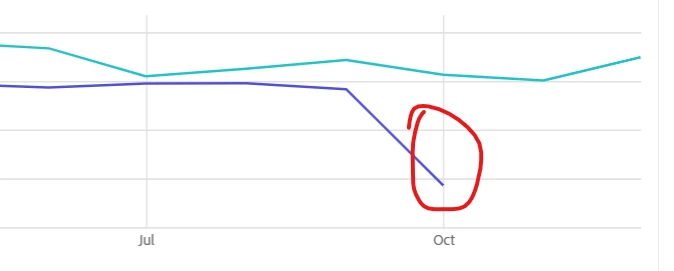
I am trying to set up a year over year comparison of Visits. With the dimension either being Week or Month, I want to show, for example all of 2021, but then for 2022, rather than the line dropping to 0 for November and December, is there a way that the line just ends at where it currently is, so we don't see a huge drop until time catches up?
Solved! Go to Solution.
Views
Replies
Total Likes
So I assume you are looking at something like:
or
Where the current partial month looks really bad by comparison.
You can use a little trick to create a segment that will exclude traffic from "this month":
(Notice the entire segment is an exclude rule - and you can change the metric to something more appropriate for your graph)
You can apply to the panel, or to the "current year column" in your data table, and it will result in:
or
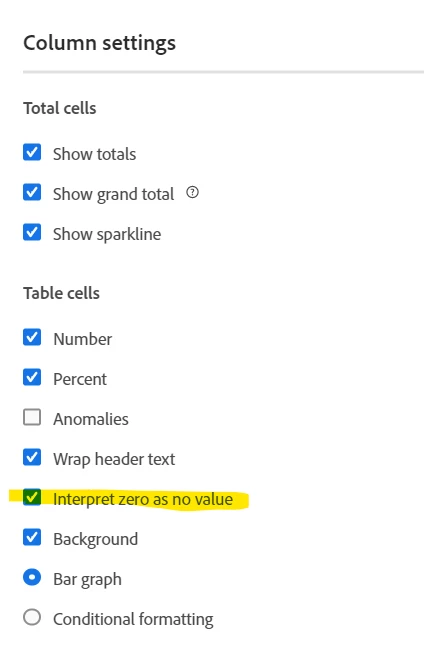
Notice that all the data from this month (October) is removed. I also made sure to "interpret zero as no value":
Now, October's data will only show up once it's Nov 1, and November will then be hidden.
Brilliant!!! Thank you so much!
Views
Replies
Total Likes
You're very welcome! Glad I could help.
Views
Replies
Total Likes
Views
Likes
Replies
Views
Likes
Replies
Views
Like
Replies