Why does the Approximate Distinct Count not match the number of rows of what I am counting?
I have created a custom metric using Approximate Distinct Count for my member IDs.
I wanted to validate that this lines up with the number of Member IDs who are clicking a CTA, so I created two tables - one with this distinct count metric, and one with the unique visitors metric. Both are broken down by my member Id dimension.
But what I am noticing is that the distinct count metric doesn't actually give a number which is the same as the number of IDs, am I missing something? Is there a way to get that, and if not, what is it actually giving me?
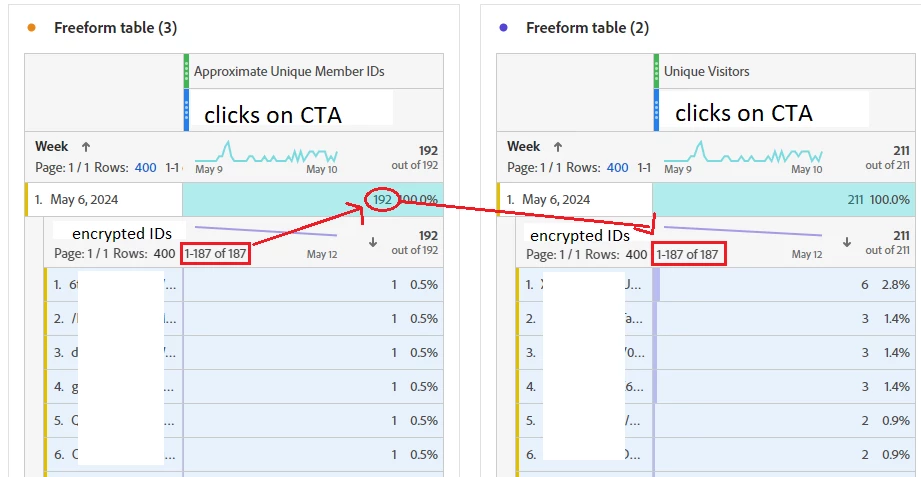
Here is an example where I compare the distinct count to the unique visitors metrics.

Evidently, the number I was expected for the distinct count was 187 - as there are 187 IDs which interacted with this CTA - I also confirmed this by extracting the data into excel. So where are the additional 5 coming from? What is 192? Is there a way to simply report on the 187? I understand this is already available in that table view, but when I create free-form tables with multiple columns, I can no longer use that figure because it will be for the unique user IDs across all of the columns/ctas/pages that I am reporting on.
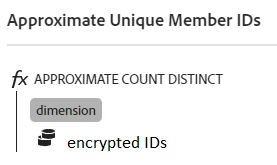
Also, here is how I created the metric:
