Solved
There is a setting on the column to "Interpret zero as no value"
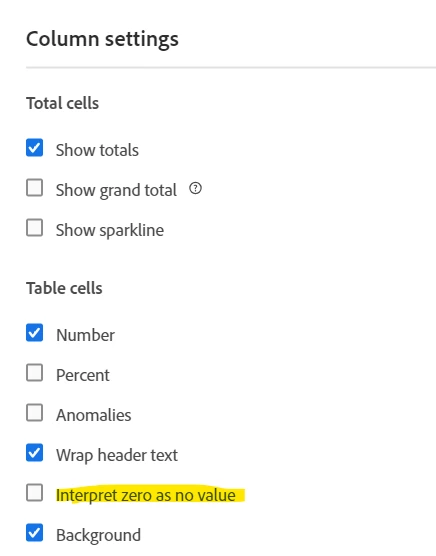
It looks like you or someone else applied this to that column (or maybe in your User Preferences so that newly added columns are using your set preference)
You can change this display at any time to suit your needs.
Enter your E-mail address. We'll send you an e-mail with instructions to reset your password.