Solved
What does this mark mean?
Hi,
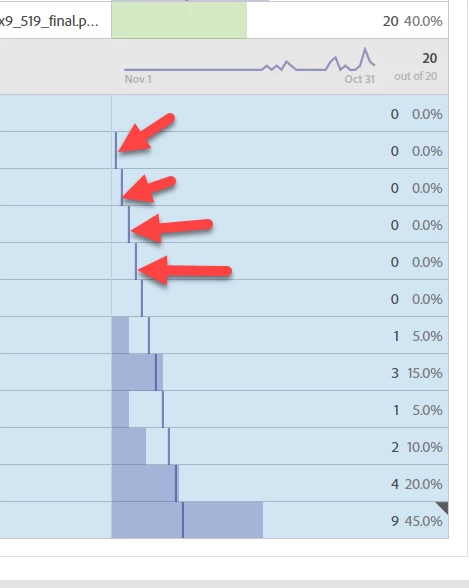
I was wondering what the marks in this graph mean. Is this a statistical figure (mean etc.)? Anyone an idea?
Thanks for helping me!
Juergen
Hi,
I was wondering what the marks in this graph mean. Is this a statistical figure (mean etc.)? Anyone an idea?
Thanks for helping me!
Juergen
The line represents the "expected" value for that period.
Enter your E-mail address. We'll send you an e-mail with instructions to reset your password.