Visualization (Line Graph) - Pageview | Community
Skip to main content
Level 2
April 8, 2021
Solved

Visualization (Line Graph) - Pageview

  • April 8, 2021
  • 3 replies
  • 1394 views

Hello everyone,


I have a situation where the pageviews that I got after filtering few page names but when I tried to visualize it using Line Graph it shows total Page Views while I want it to show Page Views only for filtered Page Names. Attaching the screenshot for your reference.


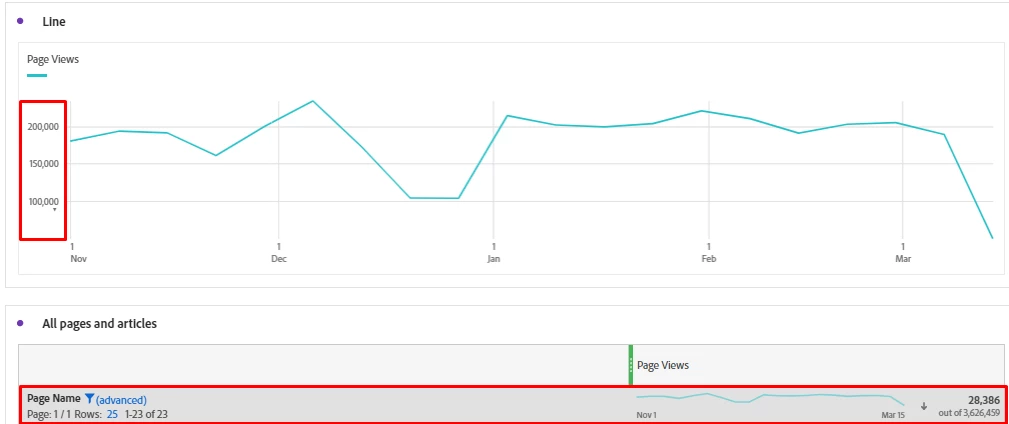
Is it possible to visualize Line Graph only for filtered Page Views?

Thanks


This post is no longer active and is closed to new replies. Need help? Start a new post to ask your question.
Best answer by jeff_bloomer

Hi @roshang!


Honestly, the easiest way to do this reliably is to just build a segment at the hit level for the pages you want to filter.  Explicitly dragging them in, as @yuhuisg suggests, will also do the same thing, but having one or more segments you can simply update and drag into your report will also make things easier to manage.

3 replies

yuhuisg
Community Advisor
Community Advisor
April 8, 2021

Unfortunately, it doesn't seem to be possible when you use a filter.

If you are graphing for a few Pages only, you could drag-and-drop each Page item into the table manually. The total will then be the total for those included items only.

jeff_bloomer
Community Advisor and Adobe Champion
jeff_bloomerCommunity Advisor and Adobe ChampionAccepted solution
Community Advisor and Adobe Champion
April 8, 2021

Hi @roshang!


Honestly, the easiest way to do this reliably is to just build a segment at the hit level for the pages you want to filter.  Explicitly dragging them in, as @yuhuisg suggests, will also do the same thing, but having one or more segments you can simply update and drag into your report will also make things easier to manage.

Level 2
April 12, 2021

Adding only specific dimension values from the Page Name dimension should return the expected output with the line visualization.


Example: Create a freeform table like this, and apply the line visualization to it.


Page name             Page Views

Home-Page             2 


Thanks,

Himanshu