Solved
usage of Path views
describe the path views in page flow analysis ?
describe the path views in page flow analysis ?
In viewing a path report you will see the metric called a "Path View". It counts the number of times a particular path happened.
A path view, in reality, is simply a report table with a segment and a metric applied. Here is the table header underlying a flow from entered on the WebMD home page.
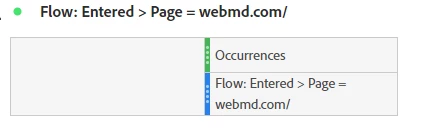
As you can see, Path Views are Occurrence based. However, if you are pathing evars, the evar persistence is removed.
Steps to see this for yourself:
Enter your E-mail address. We'll send you an e-mail with instructions to reset your password.