Time spent per visit Vs. Average time on site Discrepencies
We are trying to understand the difference we are seeing here just by transposing the table.
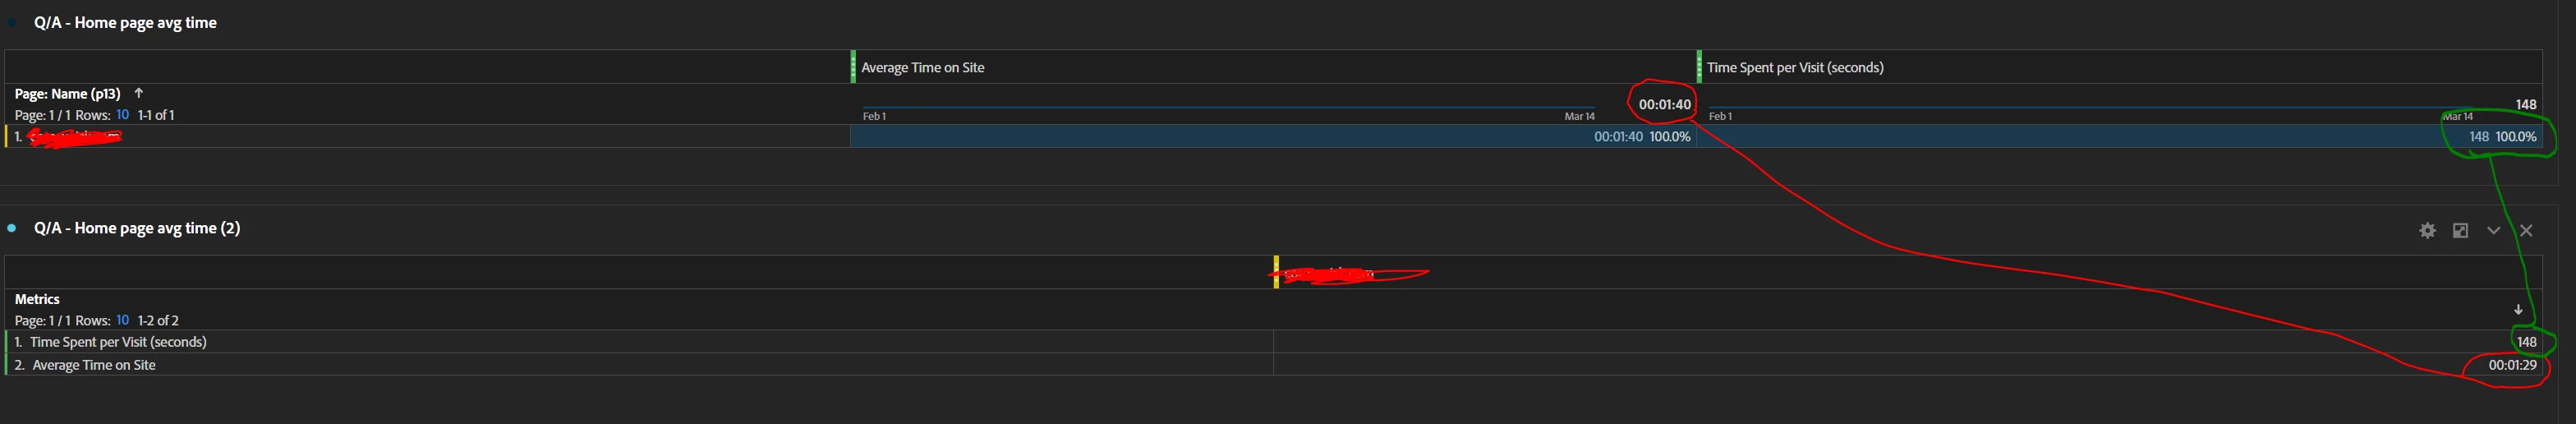
The "Time spent per visit" is the same when we have the table transposed however the "Average time on site" changes. Why is that?
From adobe - the delta between the two metrics is:
"Time spent per visit (seconds) metric and Average time spent on site are similar, but have several key differences. Both metrics use ‘Total seconds spent’ as the numerator. However, ‘Average time on site’ uses the sequences that include a dimension item as its denominator. Time spent per visit uses visit count as its denominator.
As a result, these metrics yield similar results at a visit level, but are different at a hit level."
But it does not explain why transposing the table is changing the numbers for "Average time on site" from 1:40 -> 1:29