Time series visualization labels | Community
Skip to main content
July 8, 2020
Solved

Time series visualization labels

  • July 8, 2020
  • 2 replies
  • 1735 views

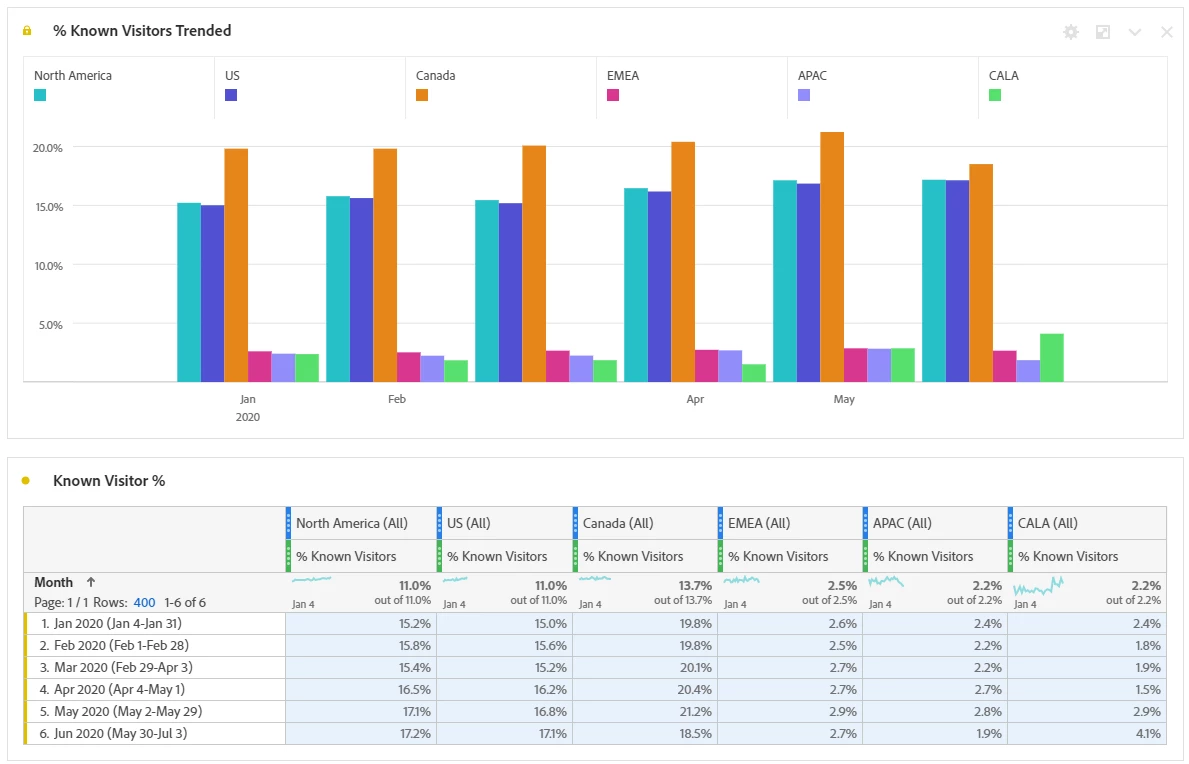
Hi, many of my time series visualizations (line, area, bar) show missing or 'shifted' time series labels.  I think this happens because we use a fiscal calendar.  Is there any way around this besides creating my own custom time periods and using them in place of the native time periods (day, week, month)?  The example below shows missing months for instance.


This post is no longer active and is closed to new replies. Need help? Start a new post to ask your question.
Best answer by isinha

Hi @phil_h14 ,

Are you seeing this behavior across all the visualizations? If that's correct, would you mind reaching out to Adobe Client Care with all the details? Ideally, the labels shouldn't be missing even if fiscal calendar is used. This is worth investigating.

Thank you!

2 replies

isinhaAdobe EmployeeAccepted solution
Adobe Employee
July 9, 2020

Hi @phil_h14 ,

Are you seeing this behavior across all the visualizations? If that's correct, would you mind reaching out to Adobe Client Care with all the details? Ideally, the labels shouldn't be missing even if fiscal calendar is used. This is worth investigating.

Thank you!

Phil_H14Author
July 9, 2020
Yes, I've experienced this across any visualization where I'm trending by month. I'll go ahead and open a Client Care ticket. Thanks!
Adobe Employee
July 9, 2020

The fiscal calendar can also be a possibility, but we would like to get it checked from backend to ensure there aren't any bugs.

Thank you!