Solved
Summary Change visualization - Facing problems with color for increase/decrease in %age change
Why the decrease/increase i%age difference in summary change in data visual is showing with green/red colour? Please someone help me out.
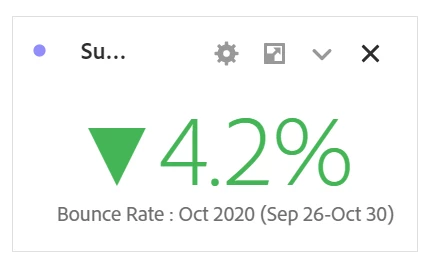
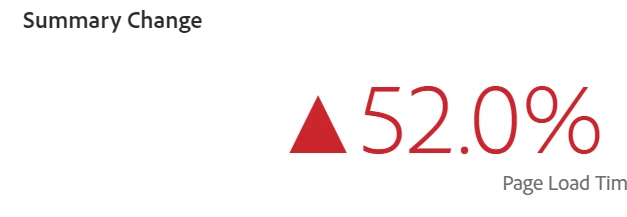
Why the decrease/increase i%age difference in summary change in data visual is showing with green/red colour? Please someone help me out.
The color depends on the Polarity setting. If the metric is a custom event, go to the report suite manager and update the setting for the corresponding variable. If you are working with a calculated metric, edit it to update that setting.
When the setting is set to "good", the growth will be highlighted with green and the fall with red. When the setting is set to "bad" the colors will be displayed inverted.
Enter your E-mail address. We'll send you an e-mail with instructions to reset your password.