Strange analytics dashboard behavior
Hello Everyone,
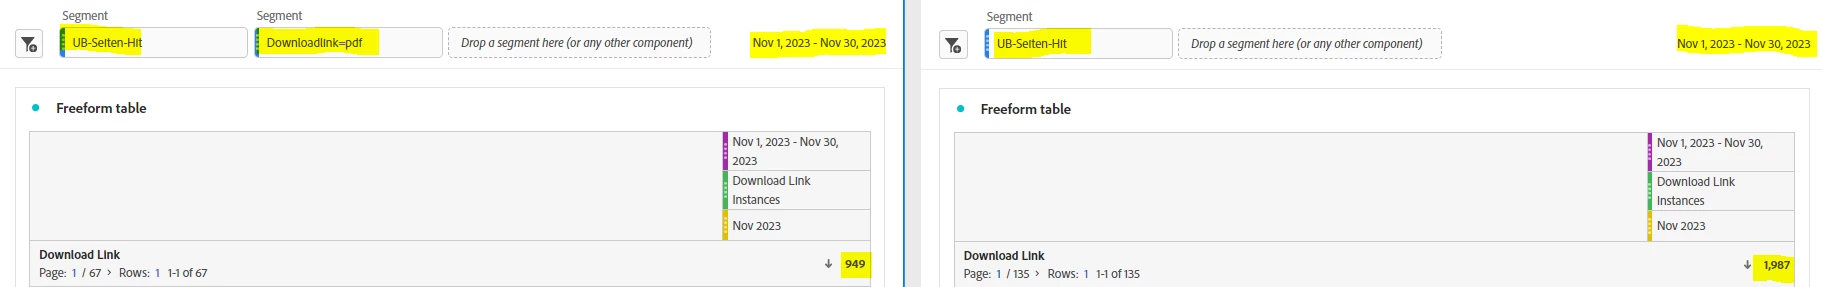
The strange behavior seems to apply only in combination with the metric, a segment for the Download Link dimension and the chosen panel date range and ONLY for November.
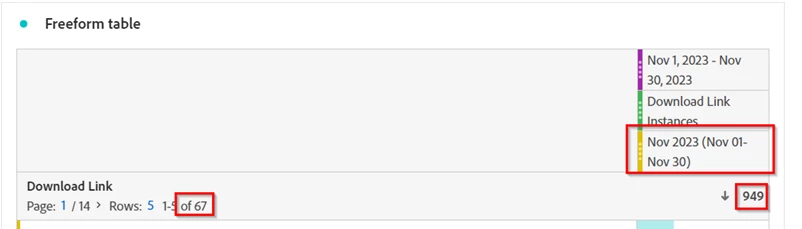
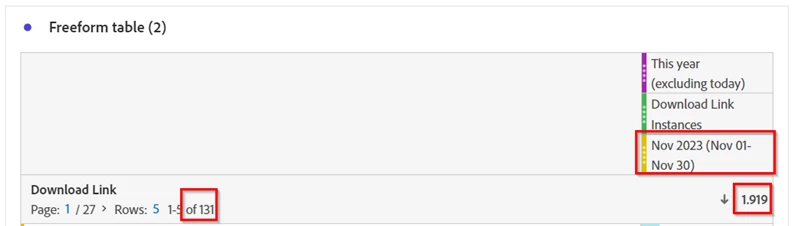
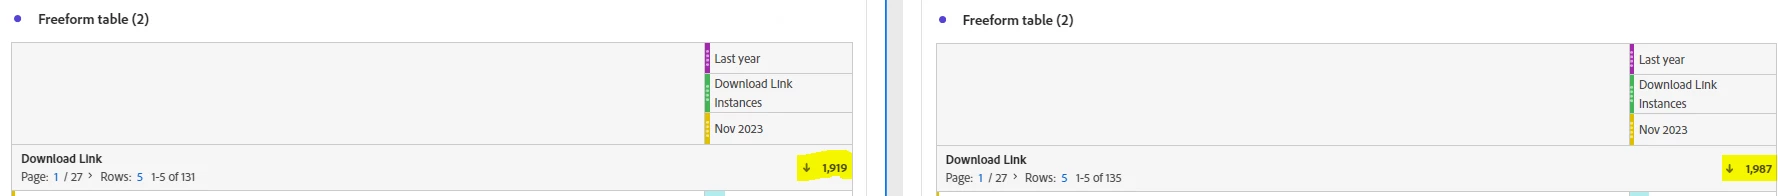
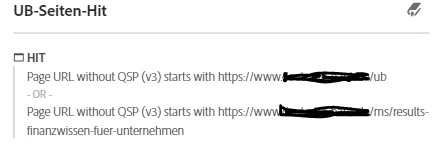
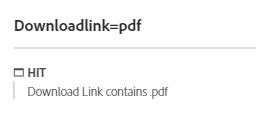
As you can see the values don’t match at all even though I would expect them to be the exact same – no matter if I apply the date range filter (purple) for the specific month or for the whole year, because at the end I am limiting both tables by the Month dimension item “Nov 2023 (Nov 01-Nov 30)”. And it’s getting even crazier because the problem only occurs when you use the panel filter “Downloadlink=pdf” AND for November… any other combination does not result in this problem so it seems to be exclusive for November. Funny thing is, the instances / values for specific dimension items don’t change but the amount of specific items (67 vs 131).
At the end this is so confusing and does not make any sense for me. Can anyone explan for this odd “behavior”? I’m also wondering what this “finding” implicates for other date ranges, dimensions items and metrics.