Hi,
I am going to assume you have at least basic familiarity with both tools (i.e. the Platform debugger showing all the dimensions and additional information about the calls, and filtering the Adobe calls by "b/ss" in the network panel).
In the platform debugger you will see the dimensions as the full names (i.e. "prop1", "eVar1", etc), and if you are logged in, you will even see the names that have been applied to your suite in Adobe (i.e. "prop1 - some name", "eVar1 - some other name", etc).
In the Network panel, you will see the URL designations, c# are used for props (c1 = prop1, c2 = prop2...), v# is used for eVars (v1 = eVar1, v2 = eVar2....), you will also see l# for lists and h# for hierarchies, g is your URL, ch is your channel/site section.
The way you can tell a s.t() call from an s.tl() call, is the inclusion of the pev values (page events):
- pe = page event (this will be lnk_o for custom links, lnk_e for exit links, and lnk_d for downloads)
- pev1 = the link URL (this will be used for exit links report, but hidden for custom and download links, which defer to pev2 value)
- pev2 = link name
In the Platform debugger, you will see them referred to as link Name (pev2), Link Type (pe) and Link URL (pev1):
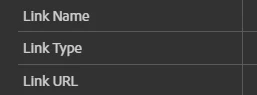
On page views, these will be empty, on clicks / actions / etc using the s.tl() call, these will have values passed.