Report Suit | Community
Skip to main content
December 15, 2023
Solved

Report Suit

  • December 15, 2023
  • 2 replies
  • 2762 views

Hi Team , 


 I wanted to fetch day wise and market channel wise data from using report suit Jason in Azure. I am not able to fetch together from one Jason file.if I use date date range day as dimensions , in response I am getting aggregate data of all channel day wise and not showing channel name also .So I need to fetch each  market channel data day wise from json response 

This post is no longer active and is closed to new replies. Need help? Start a new post to ask your question.
Best answer by Jennifer_Dungan

Hi ,


Thank you for explanation, I understood. I need one more information about JSON output, when we fetch data using using JSON, we get response, in that response, in rows arrays, in “value” variable either its mention date

 or market channel name (if we use market channel breakdown). So can we get both date and channel name in output response then we can easily find out , data is belongs to  which market channel and on which date.


For each row returned by the API, you will have the Date, and data for each column:


"rows": [ { "itemId": "1234567", "value": "Dec 1, 2023", "data": [ 23455, 3435, 7568, 68678, 5675, 567, 765 ] }, ....


The Date is obvious (Dec 1st, 2023 in this example), and each data in the array corresponds to each column... 


In my example, I have 7 columns, 7 data values are returned... in the order of the columns.. So if your column 1 is "Organic Search", then you know that 23455 belongs to that channel, and column 2 "Page Search" corresponds to 3435, etc....


The columns/data will always be returned in the order specified by your request columns.

2 replies

yuhuisg
Community Advisor
Community Advisor
December 15, 2023

Firstly, it's "JSON", not "Jason". "JSON" is the abbreviation for JavaScript Object Notation, whereas "Jason" is the name of a person. Both are pronounced "Jason", though.

This guide might help you with constructing your Reporting API request: https://developer.adobe.com/analytics-apis/docs/2.0/guides/endpoints/reports/breakdowns/#second-level-breakdown In your case, your 2nd level breakdown would be "Marketing Channel", rather than "Page". See if that helps.

Phk1Author
December 16, 2023

Hi 

thanks for your suggestion It may be helpful for to fetch for particular one day from JSON. But  I need to fetch history of data ( more than year) so can’t check and change itemid manually for each day of data. I want to fetch all data in a single response from JSON as an each market channel data day level .


ex                                              C.          C2

market channe  day   

A.                     2020-10-1.         26.         46

b.                     2020-10-1.        636.     6363


c.                   2020-10-1.         544.        666


A.                   2020-10-2.       655       677


b                     2020-10-2.         66.       667


c.                      2020-10-2        355.   677


Jennifer_Dungan
Community Advisor and Adobe Champion
December 16, 2023

Will this be an ongoing date pull on a schedule or a one-time pull? Have you considered using Data Warehouse to pull this data into a CSV file that you can process? Even Data Warehouse can be scheduled, so depending on your needs, that still may be easier than the API...


However, using the method I mentioned below, I can pull data in that format in a single API call:


I've hidden my totals for my screenshot, and just pulled in a sample of my marketing channels (you would pull in all of yours as columns, and which ever metric you need, you may want Visit, or you may want Page Views or Marketing Channel Instance, etc)


This is the JSON formatted API request that pulled the Workspace Report above, and what provided to me by using the debugger (you can put in the correcy suite, change the date range, change the Marketing Channels and Orders based on your needs, and probably drop the who "project association thing" as that is specific to Workspace):

{ "rsid": "SUITEIDHERE", "globalFilters": [ { "type": "dateRange", "dateRange": "2021-01-01T00:00:00.000/2023-12-01T00:00:00.000" } ], "metricContainer": { "metrics": [ { "columnId": "1", "id": "metrics/visits", "filters": [ "0" ] }, { "columnId": "2", "id": "metrics/visits", "filters": [ "1" ] }, { "columnId": "3", "id": "metrics/visits", "filters": [ "2" ] }, { "columnId": "4", "id": "metrics/visits", "filters": [ "3" ] }, { "columnId": "5", "id": "metrics/visits", "filters": [ "4" ] }, { "columnId": "6", "id": "metrics/visits", "filters": [ "5" ] }, { "columnId": "7", "id": "metrics/visits", "filters": [ "6" ] } ], "metricFilters": [ { "id": "0", "type": "breakdown", "dimension": "variables/marketingchannel", "itemId": "2" }, { "id": "1", "type": "breakdown", "dimension": "variables/marketingchannel", "itemId": "1" }, { "id": "2", "type": "breakdown", "dimension": "variables/marketingchannel", "itemId": "7" }, { "id": "3", "type": "breakdown", "dimension": "variables/marketingchannel", "itemId": "9" }, { "id": "4", "type": "breakdown", "dimension": "variables/marketingchannel", "itemId": "3" }, { "id": "5", "type": "breakdown", "dimension": "variables/marketingchannel", "itemId": "10" }, { "id": "6", "type": "breakdown", "dimension": "variables/marketingchannel", "itemId": "5" } ] }, "dimension": "variables/daterangeday", "settings": { "countRepeatInstances": true, "includeAnnotations": true, "limit": 400, "page": 0, "dimensionSort": "asc", "nonesBehavior": "return-nones" }, "statistics": { "functions": [ "col-max", "col-min" ] }, "capacityMetadata": { "associations": [ { "name": "applicationName", "value": "Analysis Workspace UI" }, { "name": "projectId", "value": "undefined" }, { "name": "projectName", "value": "New project" }, { "name": "panelName", "value": "Freeform table" } ] } }


Jennifer_Dungan
Community Advisor and Adobe Champion
December 15, 2023

In addition to the above documentation, here is a little known trick for building out API calls:


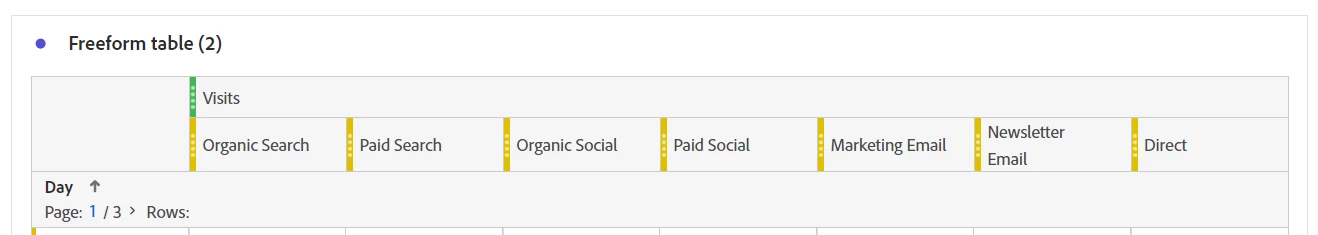
Workspace Reports are all built using the API, and you can get all the calls that are used to make your tables of data. 


You first have to enable the debugger:


This will add a new icon onto your tables:


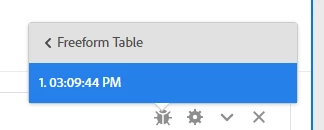
When you click on this, it will first ask you if you want to get the calls for the Freeform Table or for the Sparkline (choose the Table)


Next, it will show you different timestamps, some complex tables may need multiple calls, you can check each of these, and when you choose them, it will take you to a new screen that will show you the API requests in different languages (you can take the one relevant to you and use it as is, or modify it to suite you better.


Basically, if you can build a basic freeform table that returns the data you need in Workspaces, you can use those same calls to get the same data into your external data pulls.


Good luck.

Phk1Author
February 9, 2024

I tried JSON which given by debugger but in output response I am getting only visits data but not getting segments name level.I want to see segments name and visit data in output response.For your information Dimension parameter is missing in JSON which is given by debugger