Expand my Community achievements bar.

SOLVED

Report for hour of the day

Avatar

Level 4

Hi everyone,

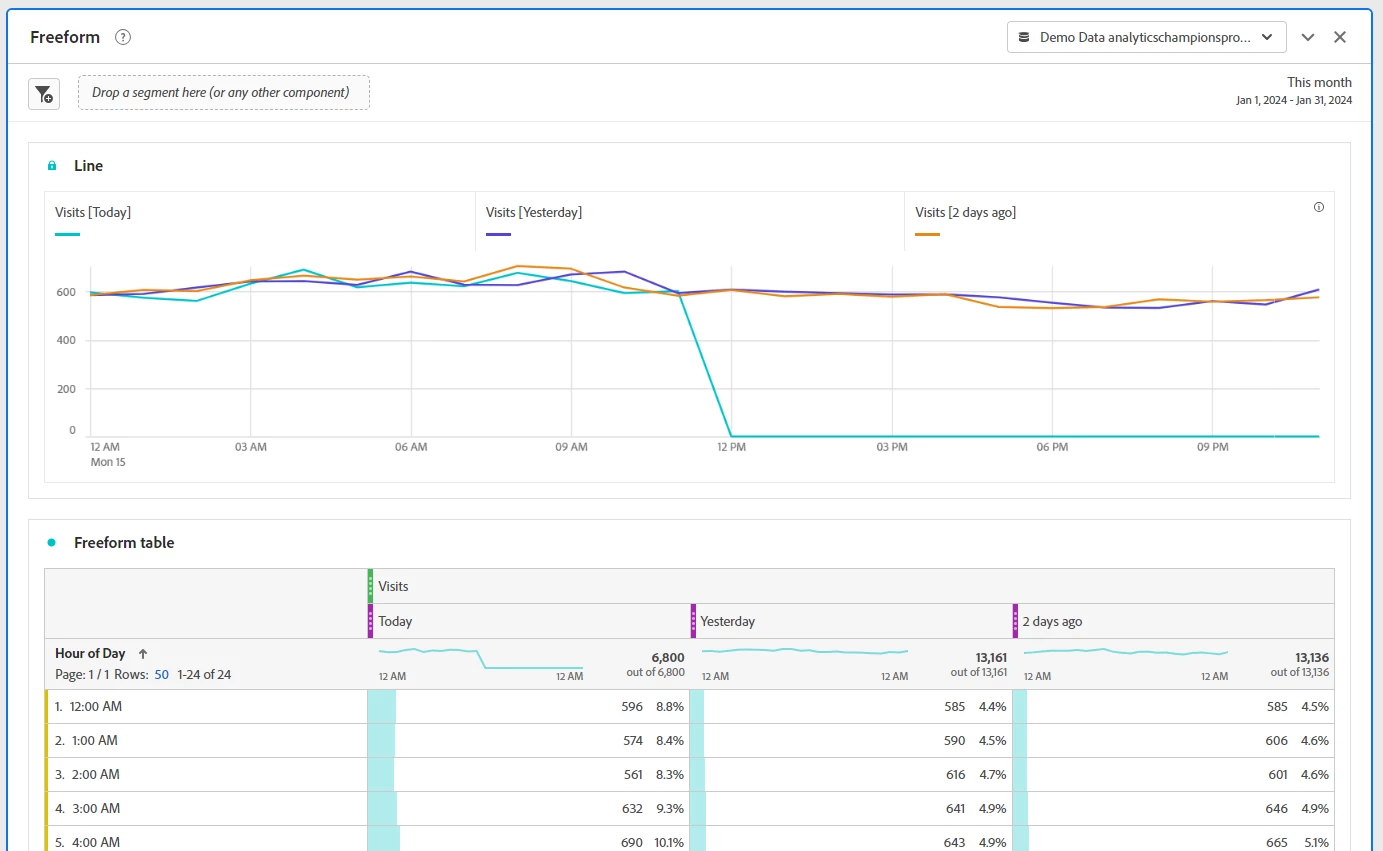
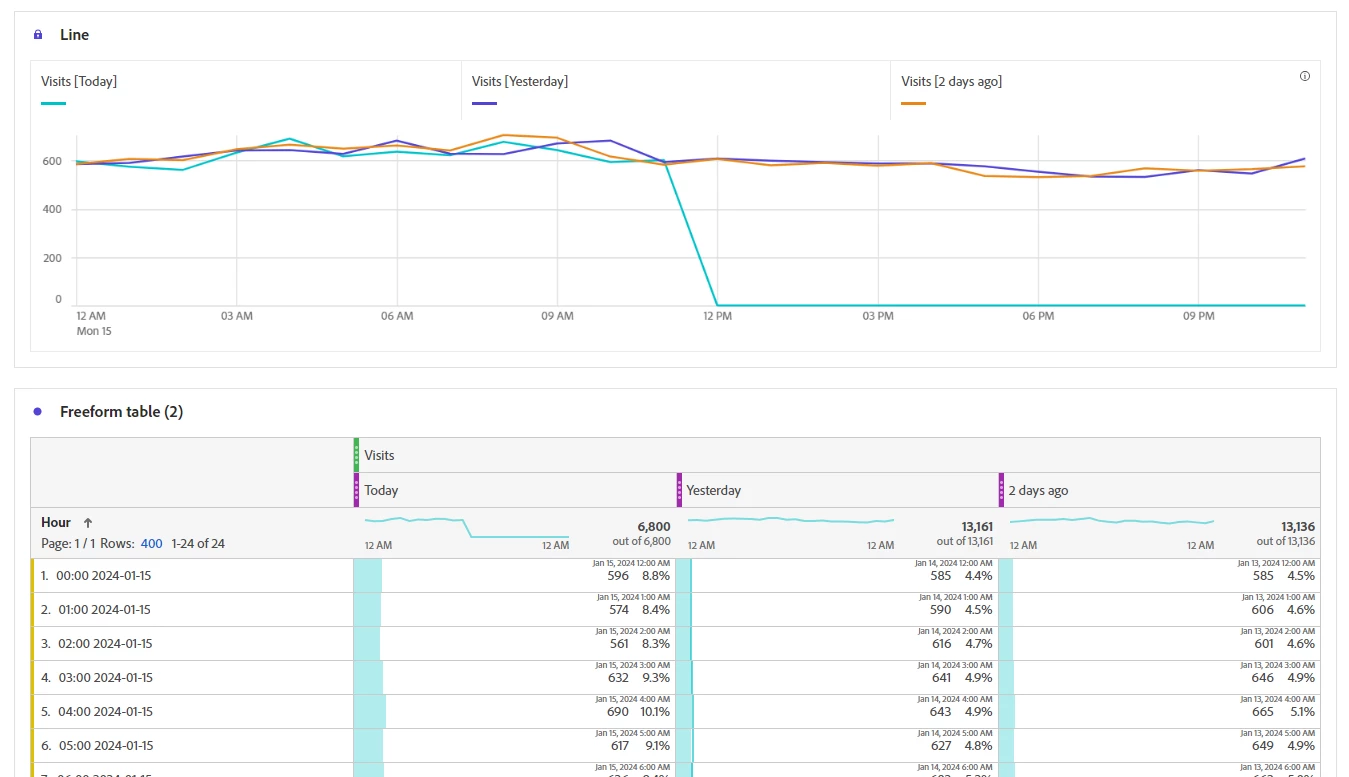
I need to visualise the report where hour of the day in dimension and visits with 2 date ranges column . Today and day before yesterday..

When , I tried line visualisation, the each hours in dimension in visits are showing different line.

Can anyone tell me how this can be done?

1 Accepted Solution

Avatar

Correct answer by
Community Advisor

I have thrown together a small sample using demo data:


Jennifer_Dungan_0-1705352523608.png


Even when using "Hour" dimension, Adobe will generally combine the hours for comparison like so:

Jennifer_Dungan_1-1705352641213.png


Is this what you are getting? If not, can you share a screenshot (you can block out values for privacy purposes)? 

View solution in original post

7 Replies

Avatar

Community Advisor and Adobe Champion

Hi @AEPAA ,

Correct me if I misunderstood your ask, but it sounds like you've got hour as a dimension down the side, visits as a metric across the top, and then two date ranges filtering the metric. Are you using date as a dimension, or the custom date ranges (the purple ones)? With the error you're getting, it leads me to believe that you're using the day dimension. Workspace gets a bit picky about how it displays stuff like that. When you're using the actual dimension and breaking it down by hour, it recognizes the dimension as having occurred at different times and adjusts accordingly. If you switch to using the purple date ranges instead, it should give you a graph where both days are trended together. 

Avatar

Level 4

Hi @MandyGeorge ,

I am using dimension - hour of the day.

And yes visits filtered on two custom date ranges.

I am supposed to get 2 lines in the line chart but then , I am getting multiple lines.

Avatar

Community Advisor and Adobe Champion

Oh, I missed the "of day" part initially.

"Hour" and "hour of day" are treated differently in workspace. Hour is treated as a time dimension, which is essentially continuous, hence how the line graph flows from one hour to the next. Hour of day, on the other hand, is treated like a dimension with each hour being a unique variable. For example, if you had "homepage", "cart", and "checkout" down the side, those are all discrete items in the dimension, there wouldn't really be a flow from one to the next (because those could come in any order). 

Hour of day is treated like that as well. Each value is treated as discrete and not continuous so it won't have a flowing line in the visualization. 


So there are two ways to go about this, the first is to keep the data in the freeform table and use "hour of day". You can turn on conditional formatting so you can see the colours on a scale from low to high, or you can use the bar graph visualization that is the default. Both will let you see the trends.

Second option, switch to "hour" and use the line graph. With "hour" you won't be able to calculate a YoY comp, but it will let you see the two lines trended together. 

Avatar

Correct answer by
Community Advisor

I have thrown together a small sample using demo data:


Jennifer_Dungan_0-1705352523608.png


Even when using "Hour" dimension, Adobe will generally combine the hours for comparison like so:

Jennifer_Dungan_1-1705352641213.png


Is this what you are getting? If not, can you share a screenshot (you can block out values for privacy purposes)? 

Avatar

Level 4

Thanks Jennifer, Yes, similar like you have shown above.

Avatar

Community Advisor

Ok, so you are seeing like the above... I am confused at what you expect to see? In my example, this line graph is comparing the three days (today, yesterday and 2 days ago), hence the three lines...


This is what the freeform is doing as well, comparing by hour the number of visits per hour of the day....


If you are trying to get just one overall trend line for the two or three days, you would need to build another freeform table, using "Hour" as the dimension and "Visits" as the metric... You can graph that, and if needed, you can hide the freeform table from the workspace.... 

Avatar

Level 4

Thanks Jennifer! ,

Yes sorry for the confusion, Actually , It was hour of the day before. I have changed to hour after Mandy and you have said. Now it's fine . Thanks!