Expand my Community achievements bar.

Join us at Adobe Summit 2024 for the Coffee Break Q&A Live series, a unique opportunity to network with and learn from expert users, the Adobe product team, and Adobe partners in a small group, 30 minute AMA conversations.
SOLVED

"Breakdown fallout at this touchpoint" segment explanation

Avatar

Level 1

Hi all,


I've been having a hard time understanding how nesting containers within a segment works in Adobe analytics.

It makes sense to me when the "Top container" is a Visit or a Visitor container, but what I'm having trouble understanding the logic behind having the "Top container" as a HIT while the nested container as a Visit or Visitor.
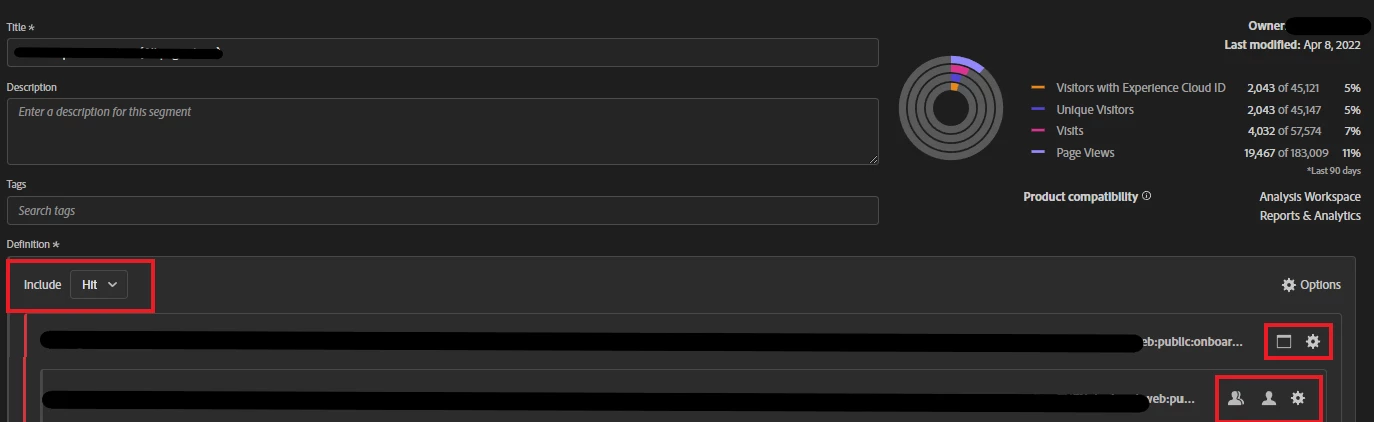
Creating a "Breakdown fallout at this touchpoint" segment from a fallout chart creates the segment below, which shows the immediate HIT after fallout at a certain touchpoint. it would be great if somebody explained the logic to me, and how it can be appended to show all the pages viewed after fallout not just the immediate Hit.


Thanks !!!

3.png

1 Accepted Solution

Avatar

Correct answer by
Community Advisor

I generally read such nested segments as "Out of everyone who has done x (i.e. Visit/Visitor-scoped container), how many hits were there that had y (i.e. Hit container)?"

Nested containers do take more time to fully understand what they're doing. It usually makes sense when you draw out some example data tables and/or consider how your data has been tracked to AA, i.e. the combination of data in the beacons/hits.

View solution in original post

1 Reply

Avatar

Correct answer by
Community Advisor

I generally read such nested segments as "Out of everyone who has done x (i.e. Visit/Visitor-scoped container), how many hits were there that had y (i.e. Hit container)?"

Nested containers do take more time to fully understand what they're doing. It usually makes sense when you draw out some example data tables and/or consider how your data has been tracked to AA, i.e. the combination of data in the beacons/hits.