The first thing is to understand the order in which your tags are processed.
1. Site Tags / Mobile App Context Variables
2. Processing Rules (still very much relevant to tagging needs, particularly when it comes to mobile apps)
3. Vista Rules (these have to be set up by Adobe and come with additional cost to configure)
4. Classifications (these can be used in a non-destructive way to apply values on top of your stored data)
Your actual tagging step should be pretty straight forward. You set your props, eVars, events, etc. In an ideal implementation, you are correct in thinking that maybe Processing Rules and Vista rules aren't needed... but IF you are doing mobile app tracking... you can't actually set the props, evars, etc directly. Some items, yes, would be set directly.. but for the most part you will want to send context variables to Adobe, then use your processing rules to set them.
After your tags, this is where processing rules fall into place. This is primary where I use processing rules.. to map my context variables to actual prop/eVar data for our mobile apps. I also use this to set some rules based on User Agent, this way I don't have to try and get the rules for web (Adobe Launch that I control), AMP Pages (which developers control), Mobile Apps, etc all coordinated... I can just set one processing rule and it works consistently for all the variants.
There is a word of caution here: Processing Rules change the values of your data, so make sure that any rules you set up are fully tested before adding them to production.
Vista Rules are similar to Processing Rules, but I believe there is most control that can be applied (as well as manipulating data to send to multiple suites - as in I could have a value in eVar1 in Suite A, that uses Vista Rules to manipulate the value in some way and sent to eVar2 in Suite B for example). Vista Rules are controlled by Adobe Support and I believe the setup of such rules have a cost associated to them.
Both Processing Rules and Vista Rules change the data that is stored in your reports.
The last part is classifications.. Classifications allow you to create (for lack of a better term) "sub-props" or "sub-eVars". Essentially, the data as recorded in your prop/eVars remains as is, but you can create rules to map different/more readable/parsed out values based on the originally recorded values... These also aren't permanent... the data is processed every 4-6 hours, and IF something doesn't work as you expect it to, you can change the rules and reprocess up to 6 months of back data.
To give examples... maybe someone in your marketing team is using some UTM values which are coded (bfs_123 for "black friday sale" and the 123 is tied to a specific date range or product). You can create Classification Rules (using the classification rule builder, if you have only a few specific rules that you are looking for; or if there are hundreds of permutations you can use the classification rule importer which allows you to create large scale mappings based on a csv file).
Or maybe you are getting really diverse values in your UTM Sources... like "facebook", "facebook.com", "fb", fbook", facebok", etc ... you may have to keep tabs on the variations, but you could create some rules on this to create a classification for "facebook" so that it's easier to pull reports.
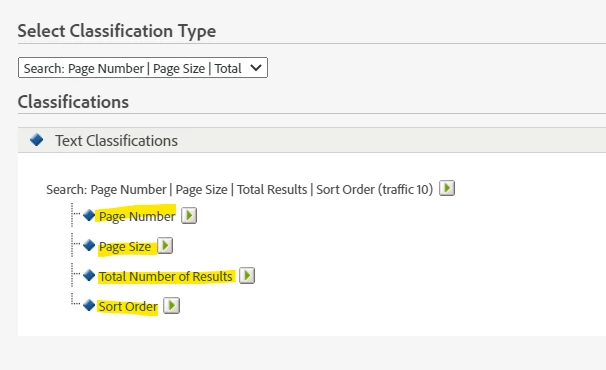
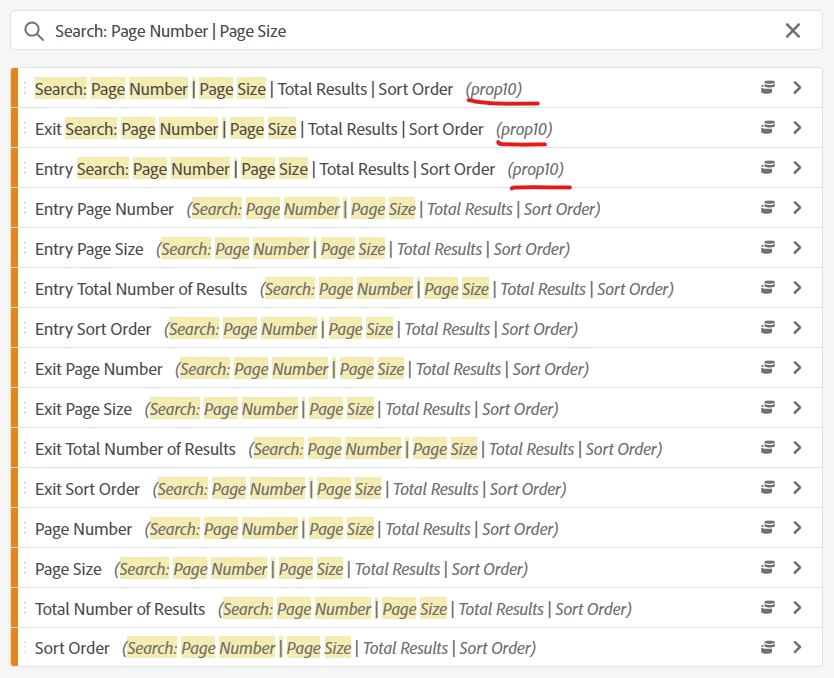
The other thing that classifications are good for is to send multiple pieces of information all together in one proper or evar like "value 1|value 2|value 3|value 4"... you can use regex rules in your classification rule builder to extract the first part "value 1" and give it a classification dimension "something A", and extract the second value "value 2" and give it a classification dimension "something else", etc (obviously you would call "something A" and "something else" appropriate names based on the type of data you are collecting... I use this method for internal search functionality, tracking the page number, number of results per page, number of total results returned and sort order. So I can minimize the number of dimensions being used, but still have each of these values in separate usable dimensions that I can correlate and use in more advanced reporting.
I hope this helps