You can also create something of an "heat" map of your traffic.
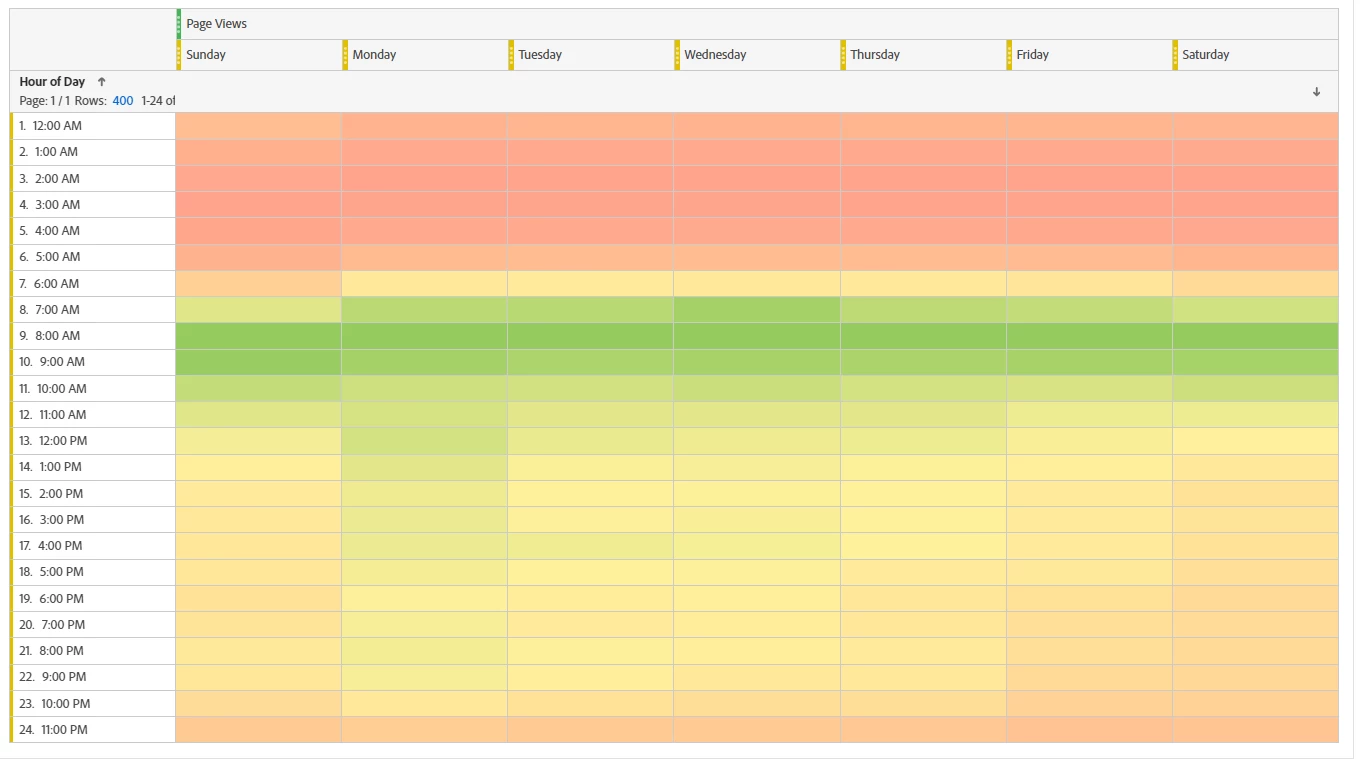
Create a table which uses whatever metric you are measuring your traffic by along the top (I will use Page Views as an example), then stack underneath that, the "Day of Week" dimensions, like so:

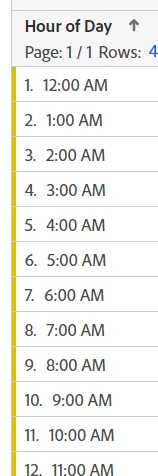
Now use "Hour of Day" dimension down the left (this is different from "Hour", it will collapse all data from all days into the same hourly bucket):
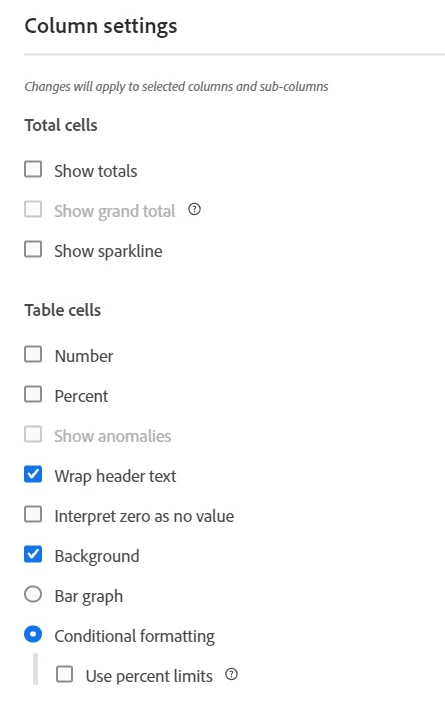
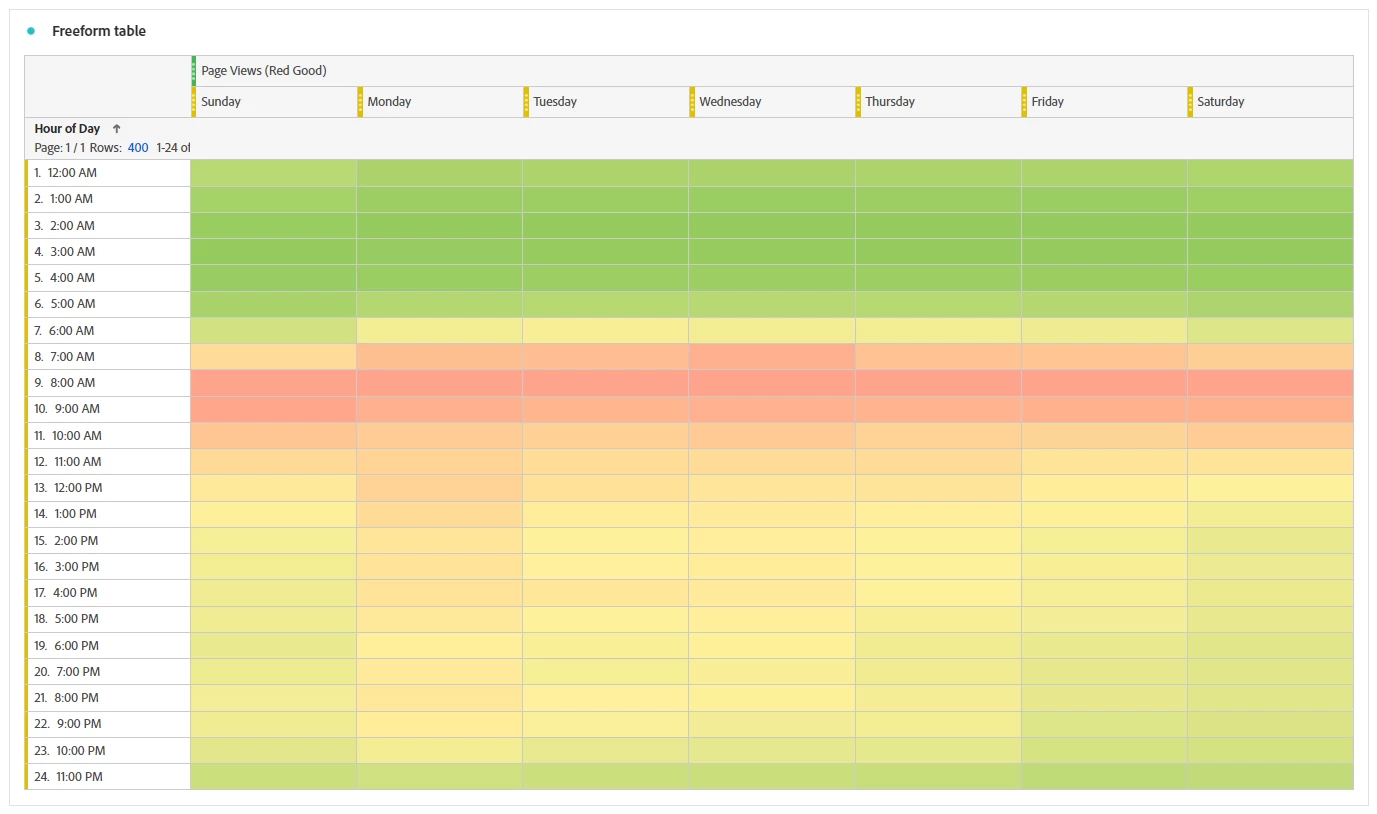
Now, you will notice that this will take a full 30 days worth of data per hour into each cell, but since we are looking for trends, and not really specific numbers (and basically this will essentially average out the highs and lows for the month), we are going to hide the values and turn on conditional formatting, like so:
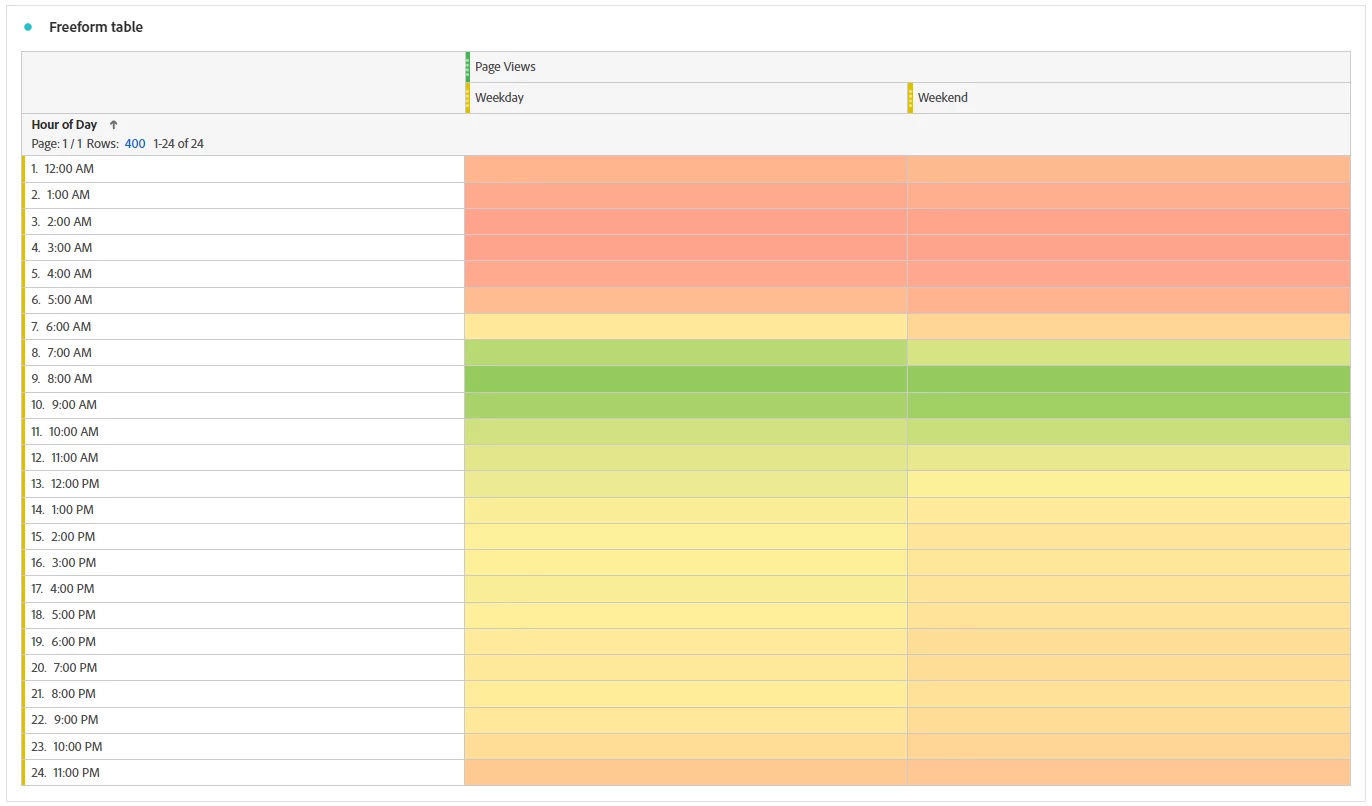
This will give you a nice visual heat map of your traffic like this:
The green will be your highest values... if you prefer to see red as the highest rather than the lowest, you can just make a calculated metric to use instead, that will look like this:
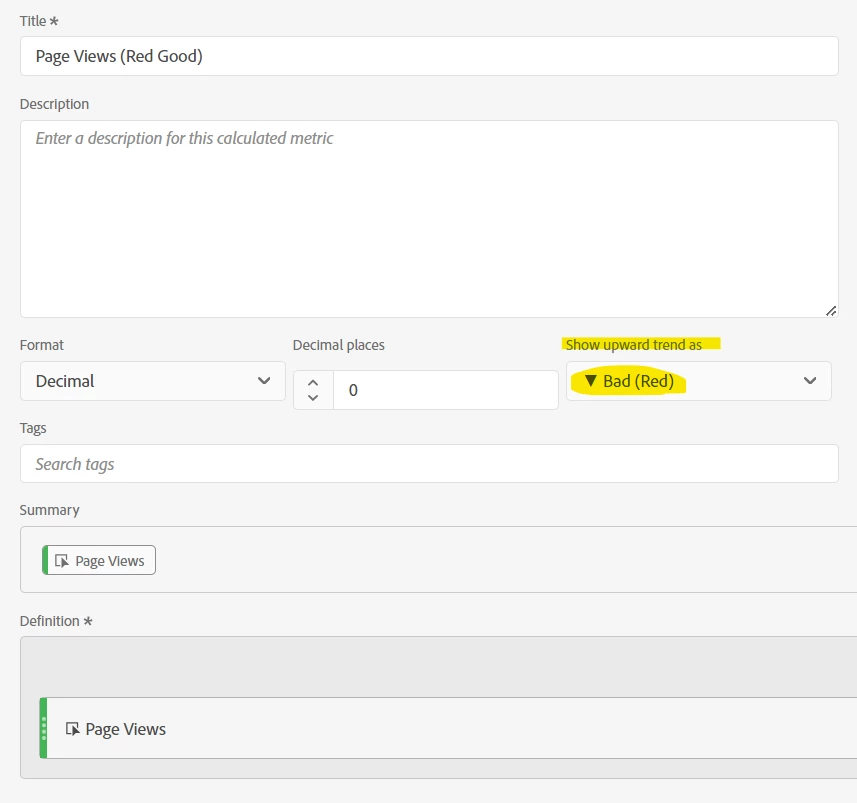
Basically, you make the "Upward Trend" bad, instead of the normal good.
If you don't care about Days of the Week, you could do similar with Weekday/Weekend, or just the metric as a single column.