Solved
Out of scale value
Hello,
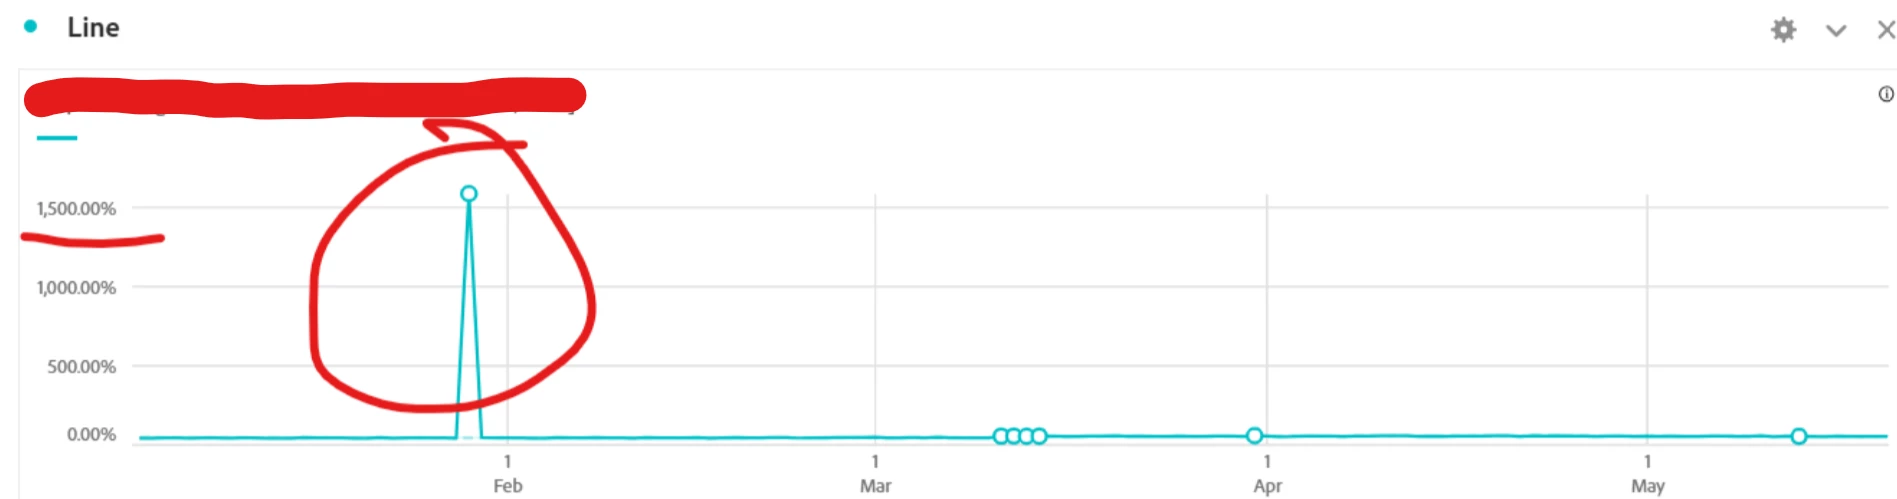
Have you ever experienced an outlier in the line chat that makes you impossible to read the normal values?
I'm referring to this chart
Hello,
Have you ever experienced an outlier in the line chat that makes you impossible to read the normal values?
I'm referring to this chart
Yes.
I am assuming that was an invalid spike? And not something like a one day flash sale or something that went viral causing a real spike?
Sometimes what I will do, is to create an ad hoc segment to identify fraudulent spike data and exclude it within the report. I try to limit this to only the day/time where the spike occurred (using the Day / Hour / Hour of Day / etc dimensions to "time block" it). I will make a text note saying that the exclusion rule may not be 100% accurate, but to it was done to the best of my ability to "right size" the data.
Enter your E-mail address. We'll send you an e-mail with instructions to reset your password.