We have different products on our site like Shoes, Garments, Furniture etc. I have created 3 segments to identify these products. I have an event which gets triggered every time a user clicks on these products (Event 3). We have identified a revenue unit associated to each of these clicks.
For example -
Shoes - 1.23 per click
Garments - 0.83 per click
Furniture - 0.98 per click
So in a day if there are 200 clicks for shoes, 100 clicks for Garments & 100 clicks for Furniture, Total revenue for that day would be (Clicks * revenue per click).
Shoes = 1.23 * 200 = 246
Garments = 0.83*100 = 83
Furniture = 0.98*100 = 98
My client wants to see this calculation done on a single column in the freeform table in the below template in adobe workspace.
Total Revenue
Shoes 246
Garments 83
Furniture 98
Can I create a calculated metric to multiply different values with the corresponding clicks for each segment and showcase in a single column? Any help will be greatly appreciated. Thanks!
Solved! Go to Solution.
Topics help categorize Community content and increase your ability to discover relevant content.
Views
Replies
Total Likes
That would be the difficult part then. You can apply a static number to every row quite easily, but to get a different static number on each row is difficult. I did some testing and did come up with a solution, it's quite lengthy though, especially if you have a lot of categories.
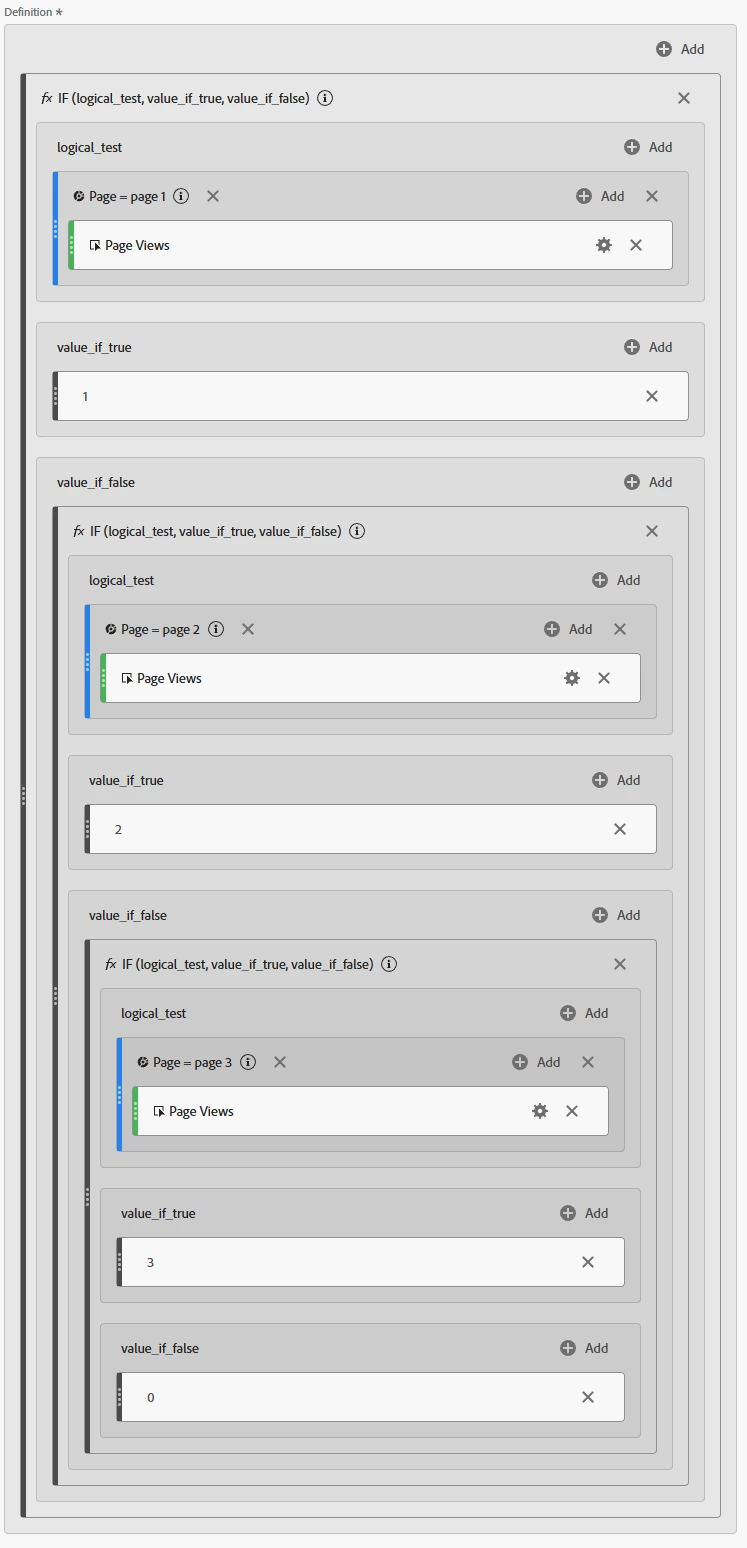
What you need to do is use a nested "if" statement in your metric. The number of nested if's will be the same as the number of categories.
I put in a screenshot below of if there are three categories. In your first if statement, for logical test I have page views with a segment for page 1 (you can change this to product views and a product category, or whatever you need). Value if True = 1 (this would be your revenue associated with click value, like 0.83 or 1.23, etc). You do this by setting it as a static number and then typing in the value you want. Value if false, I nest the next if statement. For the second If, the logical test is the next page (or product category), value if true is that category's revenue association, value if false is the next If statement. You keep going in this manner until you have a value for all of your categories. For the very last category, there won't be another if statement to next in the 'value if false' so in there just use a static number for 0.
Once you have all of your categories and their values in the nested in statements, at the bottom multiply by your click metric. This will apply the correct revenue association value on each row and let you multiply it, resulting in the correct values.
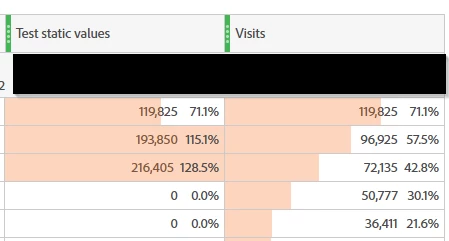
I tested it out with my own data. I did page 1, 2, and 3 like in the screenshot above. Then for mine I multiplied it by visits. The result is below, pages 1, 2, and 3 had their visits multiplied by the right static number (either 1, 2, or 3), and everything else had a static number of 0, so their visits were multiplied by that.
I hope this helps you solve your problem.
Views
Replies
Total Likes
You could consider creating a segment for each product, i.e., Shoes, Garments, Furniture then create calculated metrics based on them. As below example,
You can use link clicks instance in place of visits if that's what you are tracking. Not sure about showing them in a single column but you can have segments as columns and metrics as rows, I hope that helps!
Views
Replies
Total Likes
Whether you can do this in a single column or not depends on how you are capturing information in workspace. The formula you need is pretty basic, it's just multiplying two numbers - but do you capture both of those?
Shoes = 1.23 * 200 = 246
In this case the "200" is the clicks, hopefully you capture the number of clicks (I think that would be the event3 you mentioned).
The other number, the 1.23 for the revenue unit - do you capture this in Adobe? If every time someone clicks on the product it fires a value of 1.23, you can use the "mean" function in your metric to get the average (which if every instance is 1.23, no matter how many times it fires the average will be 1.23).
Then your formula would look like
Mean (revenue unit)
X
clicks
And that would result in a single number that would show the total revenue for each product. The hardest part is just making sure you have that revenue per click metric available. If you don't, work with your implementation team and see if you can get it captured, if so then you can at least do this type of reporting going forward.
No it is not fired during the clicks. I thought of using the static number in the calculated metric. But my main question is how to multiply different number with the clicks based on the segment. If the segment in the row is shoes, number of clicks should be multiplied by 1.23 and if the segment in the row is Garments, number of clicks should be multiplied by 0.83.
I have 3 segments in the rows, so calculated metric should be multiplied by 3 different numbers and return the result. This is my ask.
Views
Replies
Total Likes
That would be the difficult part then. You can apply a static number to every row quite easily, but to get a different static number on each row is difficult. I did some testing and did come up with a solution, it's quite lengthy though, especially if you have a lot of categories.
What you need to do is use a nested "if" statement in your metric. The number of nested if's will be the same as the number of categories.
I put in a screenshot below of if there are three categories. In your first if statement, for logical test I have page views with a segment for page 1 (you can change this to product views and a product category, or whatever you need). Value if True = 1 (this would be your revenue associated with click value, like 0.83 or 1.23, etc). You do this by setting it as a static number and then typing in the value you want. Value if false, I nest the next if statement. For the second If, the logical test is the next page (or product category), value if true is that category's revenue association, value if false is the next If statement. You keep going in this manner until you have a value for all of your categories. For the very last category, there won't be another if statement to next in the 'value if false' so in there just use a static number for 0.
Once you have all of your categories and their values in the nested in statements, at the bottom multiply by your click metric. This will apply the correct revenue association value on each row and let you multiply it, resulting in the correct values.
I tested it out with my own data. I did page 1, 2, and 3 like in the screenshot above. Then for mine I multiplied it by visits. The result is below, pages 1, 2, and 3 had their visits multiplied by the right static number (either 1, 2, or 3), and everything else had a static number of 0, so their visits were multiplied by that.
I hope this helps you solve your problem.
Views
Replies
Total Likes
Views
Likes
Replies
Views
Like
Replies