Hey there,
I am going to break this response into two sections.
Let's tackle how to get to those KPIs first. There are a couple of ways to get to those KPIs.
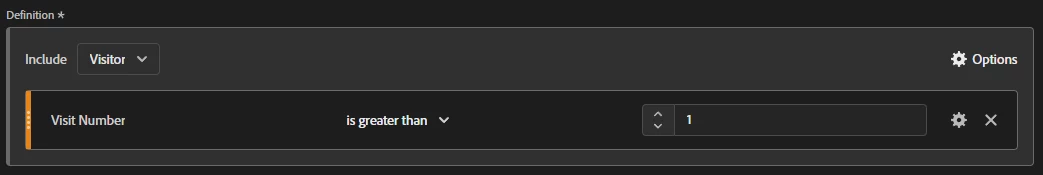
The easiest one is to create a segment for return visitors by setting the segment container to "Visitor" and defining it with the visit number being greater than 1.
Create a freeform table and drop "Visits/Visitor" and "Page Views/Unique Visitor" as columns and apply the Return Visitors segment you just created. This will allow you to see trends over time or if you drop other dimensions into the row header, compare how traffic sources, marketing channels, geolocation affect the two KPIs you're monitoring.
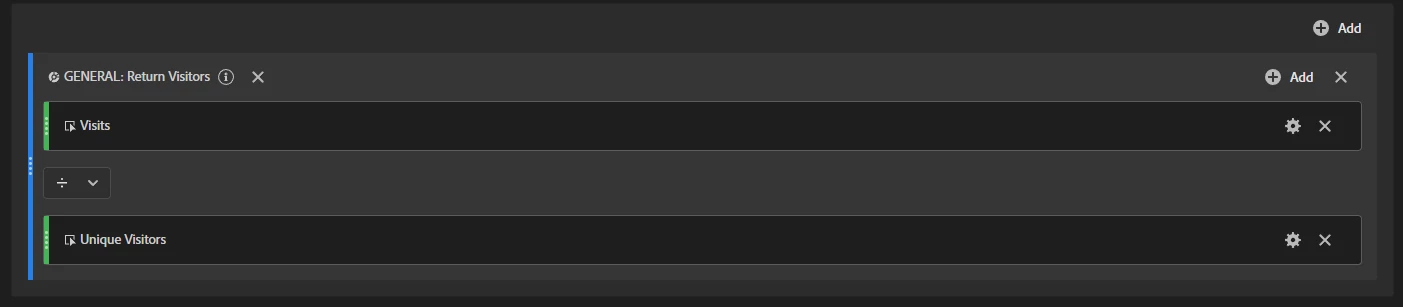
If you want the flexibility of having a calculated metric without needing to apply the segment, you will still need to create that Return Visitor segment. Drop the segment first into the calculated metric definition, and then drop visits (or page views) divided by unique visitors.
Now that you have the resources to get the data, you can figure out why your business is not meeting the target of 4 visits (or pageviews) per return visitor. First, I would evaluate if having 4 as the target makes sense. Does it take 4 pages to get to the end goal? If so, use a fallout or flow visualization to see if there are breakdowns in specific steps that stop them from moving forward.
Does it take 4 visits to complete a specific task? If so, how are visitors reminded to complete the next task in the subsequent visits? You can use that to create a freeform table to see if certain reminder channels are less effective than others.
These ideas could also help you identify if it takes users less than 4 to reach the end goal and you may need to adjust your target accordingly. Without having additional info about your business, these are general directions where I would start, but happy to help further if you want to share more information.