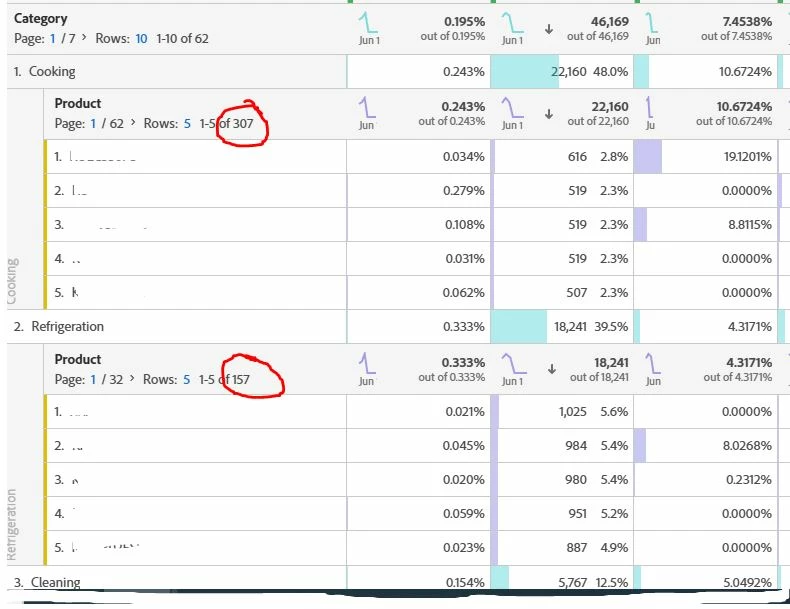
A stakeholder wants to download a freeform table with a breakdown to be able to see the full rows for the breakout. Example provided below of Category with Product breakdown, my stakeholder wants a download that shows every product row for the category.
When I highlight Category and select Download Items as CSV (Category) it just downloads the category data with no breakdown.
When I highlight Product and select Download Items as CSV (Product) it just downloads the product data with no category data.
When I highlight Category OR Product OR Category & Product and click Download Selection as CSV it will only download what is selected.
When I highlight the table and click Download Selection as CSV, it only downloads the tables with the 5 rows of the breakdown. I could in theory expand the table to show more than 5, but we will likely have situations where the rows exceed 400 anyway. This workaround would be too manual/pose issues.
Additionally my stakeholder does not want a report from data warehouse, since the data warehouse has limitations on the metrics you can include - seems you cannot build a report with custom metrics.
Anyone know a solution to this that I am missing?
Hi @ang_whirlpool,
You already mentioned most of the mechanisms available to you...
If you increase each breakdown to 400 rows, you might still not get all the data.
There are two "download" options here, "Download items as CSV (xxx)" will download up to 50,000 rows of data, but only for that level (i.e. you can download the category, or the product breakdown - but then you have to do for each category)...
Or there is "Download selection as CSV" which will only get you the values that are selected (so a complete match to what is visible).
The two options that I think might work best for you is Report Builder... you should be able to replicate your Workspace table... both custom and calculated metrics are available here, and you can add segments to help filter (though if you are using segments in your columns, you will have potentially have to run each column as a separate request)
Report Builder will also return up to 50,000 values... so depending on your data set, this may be a limiting factor....
The other option is to use the API, Workspace itself is built using the API, so everything you can do in Workspace, you can do with the API... However, breakdowns do make this more complicated...
In the older version of the API, you could pull back breakouts all in one request... the request went into a queue, you had to wait for it to finish, then you could download the report... The new API however, to get rid of the queue, has made it so that each breakdown needs to be run individually... the data is returned immediately, but let's say you have 100 categories... you would have to run 101 API calls - one to get the category list, and then 100 calls to breakdown each category...
There may still be limits here, but you should be able to do pagination (where you pull items 1-50,000 then 50,001-100,000, etc....
The last option is to set up a data lake where you take all the raw data from Adobe, process it to match what Adobe is doing, then you have access to full data in your own data lake... but this is an intensive project that you probably aren't ready to get into at this time...
Hi @ang_whirlpool ,
I think Report Builder can potentially solve your issue. I agree that with available options in the UI, you can not download the values as per your requirement. Other option is to extract the data using Data Warehouse and then performing the metrics calculation using Excel.
More about report builder - https://experienceleague.adobe.com/en/docs/analytics/analyze/report-builder/rb-overview
Best,
Isha
the max number of rows you can download is 400 at a time or use data warehouse.
But datawarehouse might be tricky if you are using calculated metrics/segments. Sometimes it wont be available.
You can also do it through datafeed setup. But unless its a one time thing I would rather do the 1st approach.
Here are few options -
1. CSV/XLSX Export from Workspace:
You can export the table directly from the UI using “Download CSV” or “Download Excel.”
But, keep in mind the limit of row limits and partial breakdowns—you may not get everything if the table is large.
2. Adobe Analytics API 2.0:
The Reports endpoint allows you to build queries similar to Freeform tables and pull complete data (including all breakdowns).
This is the best option for automation, no UI limits, and full data extraction—but it requires scripting and Adobe I/O setup.
3. Scheduled Report Deliveries:
You can schedule Workspace projects to be delivered via email as CSV or Excel, which works well for recurring summary-level reporting.
However, it’s still subject to UI rendering and row limits.
Views
Likes
Replies