Solved
In workspace, how can I put hour of day on the x axis?
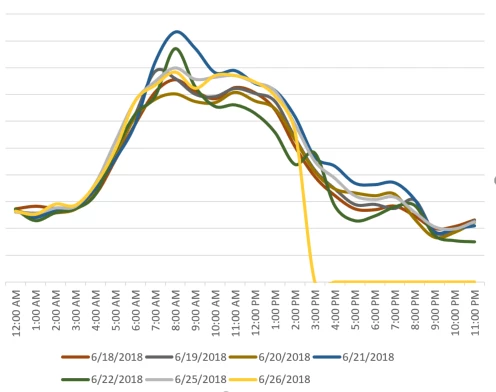
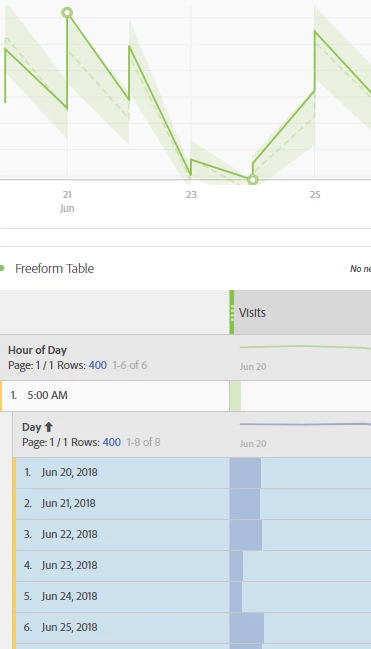
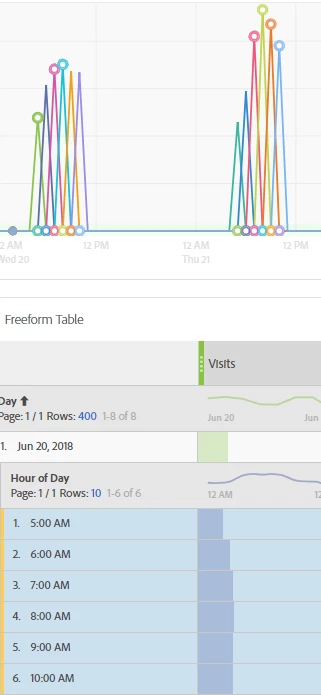
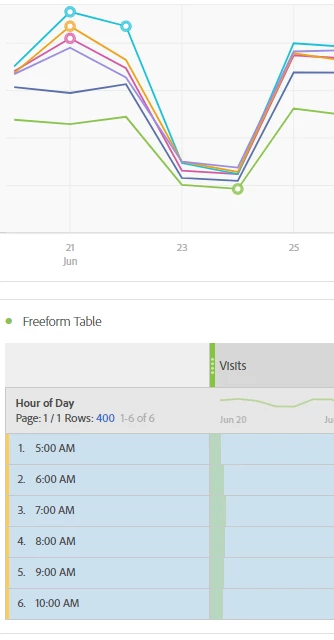
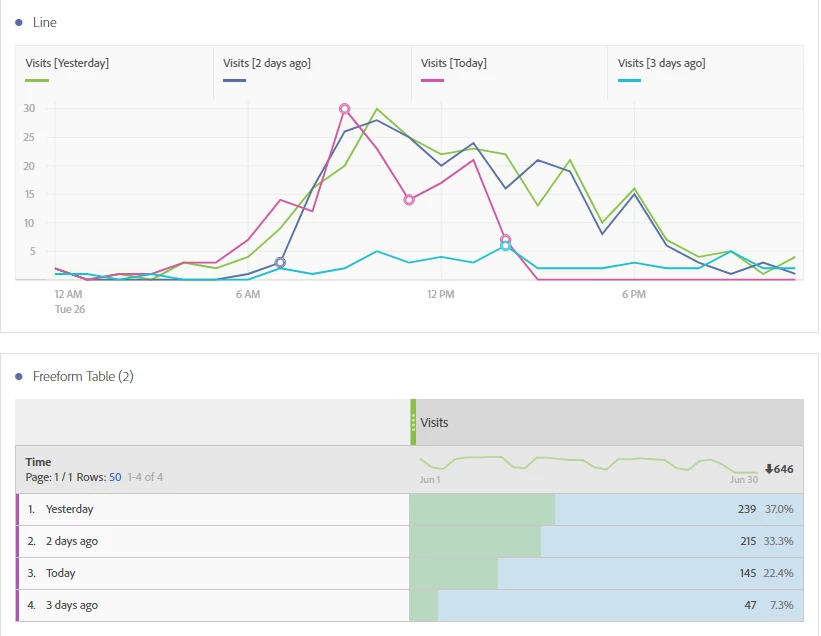
I'd like to make a line chart with the x axis consisting of hours of the day, and each line on the chart a different day. The Y axis would obviously be a variable metric. How can I accomplish this? See Excel chart for what I'd like, and a few screenshots of workspace projects that have failed - the x axis is always a date. I'd settle for a bar chart if that's what I can get, but line chart would be best. Thanks!