The first issue, where you can't see the eVars in components... that might very well be a permission issue. Do you have access to the Admin Panel? If so, check to see that for that suite, those missing eVars are included...
In my case, I set up "Auto-Included" rules, so that all dimensions and metrics are available to all users (while I could restrict this, I see no reason to...):

But, your setup may be different.. perhaps these were set up with a specific list of "at the time" dimensions and metrics, and as the scope of the tracking increased, the permissions were never updated?
The second issue... that is odd... if you didn't have access to those metrics, then they shouldn't appear in the list... I am not sure why the values would be zero....
Is this a fairly new setup? Is it possible that there are either IP exclusion rules set up to exclude everything, or bot rules set up to detect everything as a bot? Do you have processing rules that could be deleting the values before getting to the report? Maybe you don't have any of this, but someone has worked with Adobe in the past to set up Vista Rules to send this data elsewhere?
Have you tried using the Experience Debugger, logging in, and enabling "Show post processed hits"?
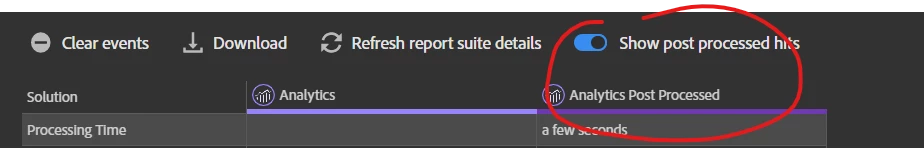
This will show a second column that will show you how the values have been processed on the Adobe side of things... do those eVars still show values?
Update: For the above, I think only data that had processing done (and has a different value) will show in that column... So if eVar5 was set in the first column, and didn't change, the post-processed column will be empty, but not highlighted...

The Timestamp changed slightly, to reflect processing time, but the "Time Since Page Load" remained as-is, so no highlight and empty....