How to update chart numbers to reflect most recent data | Community
Skip to main content
yakhtar
Level 2
August 26, 2019
Solved

How to update chart numbers to reflect most recent data

  • August 26, 2019
  • 3 replies
  • 2378 views

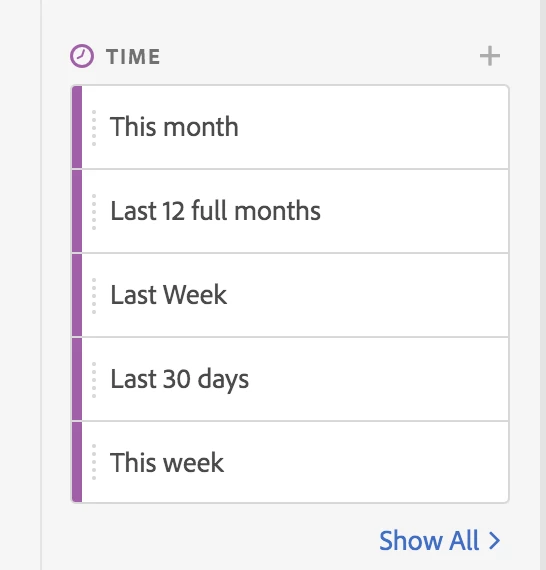
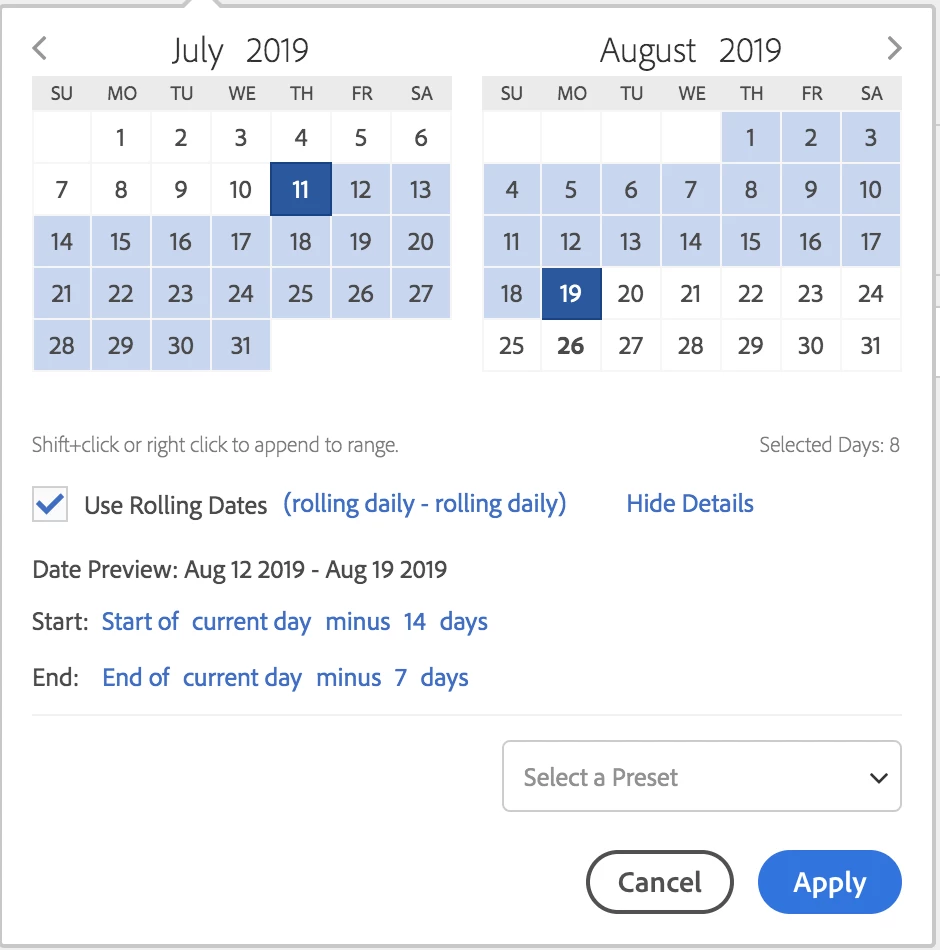
I have a workspace which captures week over week and month over month numbers. How do I make sure that each week my most recent numbers are captured. Right now each week I have to go and change the selected position.

Thanks in advance.

This post is no longer active and is closed to new replies. Need help? Start a new post to ask your question.
Best answer by surajpatra2525

you can always build custom time dimensions. click on the plus besides time in analysis workspace.

use the rolling dates option to create the filter according to your requirements.

3 replies

surajpatra2525Accepted solution
Level 4
August 27, 2019

you can always build custom time dimensions. click on the plus besides time in analysis workspace.

use the rolling dates option to create the filter according to your requirements.

yakhtar
yakhtarAuthor
Level 2
August 27, 2019

Thanks for taking the time out to reply Surajp86368405 . I do have a custom time period that does exactly what you are suggesting.

The issue I am having is that when a new week starts my summary number which I am visualizing does not update to the new week's number and stays on last week's number.

Level 2
September 4, 2019

Hi Yakhtar,

So using your calculated time periods, you could generate a table that looks like the below;

So rather than the week breakdown in your table, meaning that you need to go update the cell your summary visualisation is pointing at, you can just point your summary number vis at the visits from "this week" (calculated date period to show the last 7 days, rolling), then do your summary comparison vis showing the difference between "last week" (calculated date period to show the last 15 days to 8 days ago, rolling).

This means that each time you open this dashboard, this will update to give you the present week's data in the summary number & summary change visualisations without having to change which cell your visualisation is looking at.

Thanks,

Chris