Expand my Community achievements bar.

Applications for the 2024-2025 Adobe Analytics Champion Program are open!
SOLVED

How to get a YoY view in table?

Avatar

Level 3

Hi all,

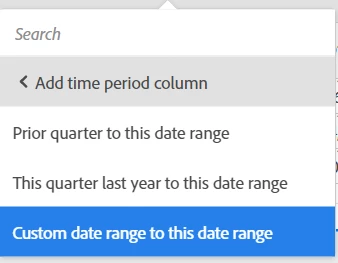
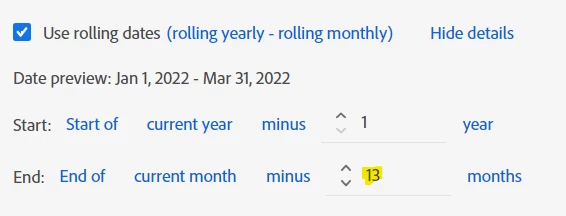
I was wondering if there was a way to use dynamic date ranges or filters to get a YoY view in a table.

What I currently have is something which looks like this:

asdf12341z_0-1681969203207.png

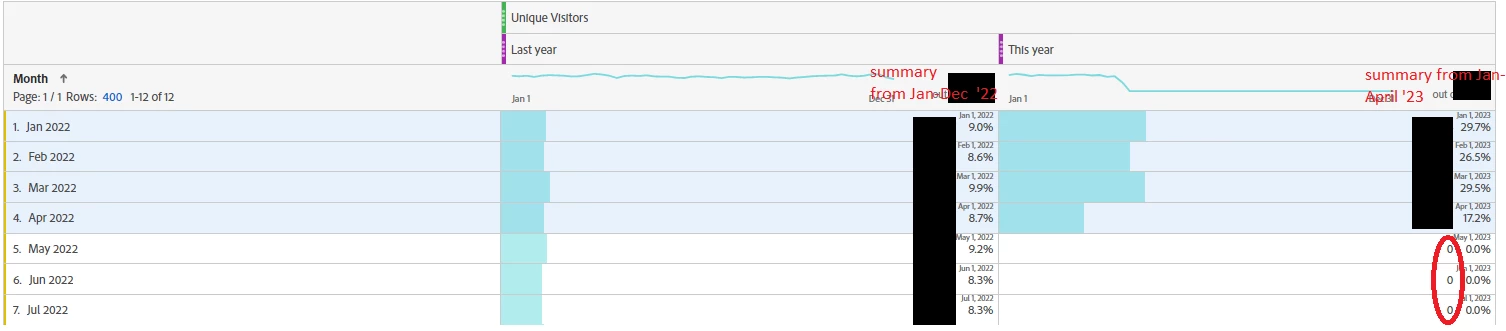
The view that I would like is to only have the numbers from the months last year that can have also occured this year - i.e., to remove the observations of May, June etc - and their contribution to the summary number at the top - until they come to pass. Is there a way to do this?


Thanks in advance 


1 Accepted Solution

Avatar

Correct answer by
Community Advisor

You can use "Custom Date Ranges" for your comparison.


Let's say your Panel Date Range is set to "This Year" (though I would argue using a custom date range here that excludes the current month would be better - so that you aren't comparing a partial month to a full month last year...)


Such a custom range would look like:

Jennifer_Dungan_0-1681998701873.png


Now, when you right click on your column to "Add time period column", choose "custom date range to this date range"

Jennifer_Dungan_1-1681998805385.png


Now, depending on whether you are using "This Year", or the custom "This Year not including this month", you can use:

Jennifer_Dungan_2-1681998872735.png

(If you are using "This Year", then change the highlighted "13" to be "12" so that you include April last year.)

View solution in original post

4 Replies

Avatar

Community Advisor

If you add year date range filter to the metric and you are comparing with another year, I don't think there is a possibility to remove the months of which data is not yet available. But you can do that manually.

  1. Select the date range of this year's months as of now (Jan - Apr).
  2. As you already using unique visitors metric, so right click on the metric and select 'add time period column' and select 'These 4 months last year to this date range'

Which will show the table like this:

Screen Shot 2023-04-20 at 8.53.26 AM.png


Hope this helps!

Avatar

Level 3

Thanks for your response Krishna. Though this technically works, I'm wondering does this mean I would need to change the date range each month? 

Avatar

Correct answer by
Community Advisor

You can use "Custom Date Ranges" for your comparison.


Let's say your Panel Date Range is set to "This Year" (though I would argue using a custom date range here that excludes the current month would be better - so that you aren't comparing a partial month to a full month last year...)


Such a custom range would look like:

Jennifer_Dungan_0-1681998701873.png


Now, when you right click on your column to "Add time period column", choose "custom date range to this date range"

Jennifer_Dungan_1-1681998805385.png


Now, depending on whether you are using "This Year", or the custom "This Year not including this month", you can use:

Jennifer_Dungan_2-1681998872735.png

(If you are using "This Year", then change the highlighted "13" to be "12" so that you include April last year.)