Expand my Community achievements bar.

SOLVED

How to create an Adobe analytics report on the day a page was visited last

Avatar

Level 2

Hi team,


Can somebody help me in creating an analytics report for the day a page was last visited.

The expected dimension is page url and the time range is one year.

1 Accepted Solution

Avatar

Correct answer by
Level 10

I tested using a segment in the following configuration, where the calendar date was set for a year.
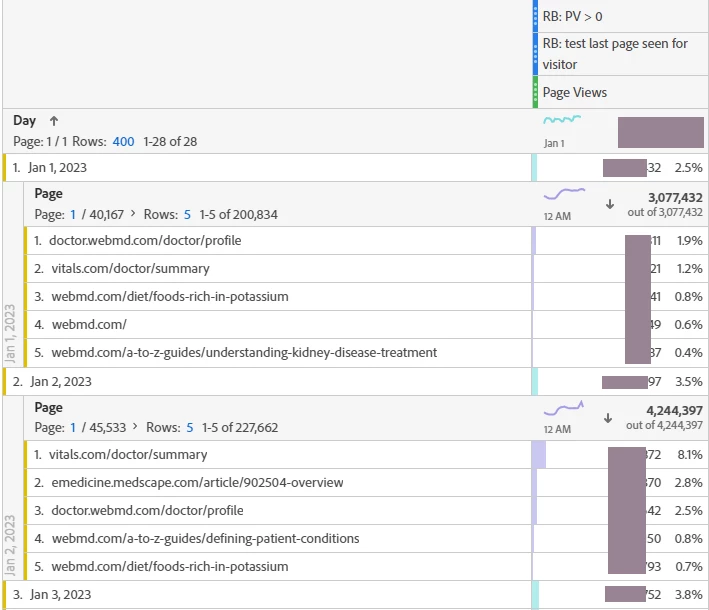
RobertBlakeley_1-1703779560431.png

The segment I used finds the last page a visitor saw in the year.
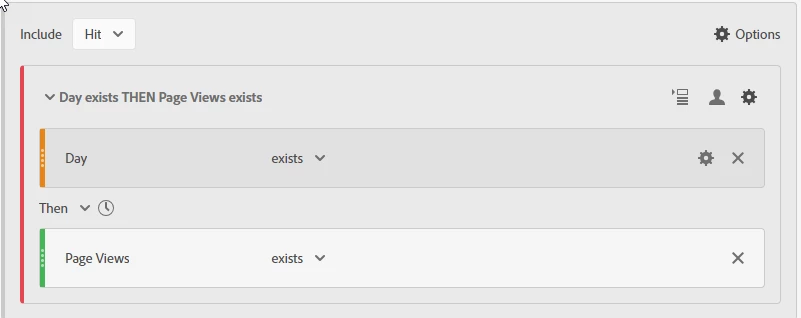
RobertBlakeley_0-1703778775869.png

However, this gives you the last time any given visitor saw a page. So visitor 1 could have seen page A as the last page on Jan 1 and visitor 2 could have seen the same last page on Dec 1.

We would need to find the last page across all visitors. I don't know if that can be done with segments. Perhaps someone else does?


View solution in original post

5 Replies

Avatar

Community Advisor

I believe you'd need to do some nested sequential segments.  There's a slide deck from a Summit Presentation that looks at something similar.  See the link below

https://www.dropbox.com/s/fnxsr9s94k63rsk/RockstarTips2019_AudreySalerno.pdf?dl=0


I thought there might be a way to use attribution with the page dimension.  But I don't see a way to do this off hand.

Avatar

Community Advisor

Actually, you might try a Flow.  Here's an example from Demo Data Sandbox.

Use the page you're interested in as the Ends With...  Use Day as the Pathing Dimension

Be sure you're using a Visitor Scope, and Limit to Last Occurrence.

Not necessarily the easiest, but might give you what you're looking for fairly easily.


Josh_KC_0-1703718997548.png

Josh_KC_1-1703719116910.png


Avatar

Community Advisor and Adobe Champion

This may sound easy if looking from a database point of view, just query the table group by page and select max(date) and return a table with two columns


page max date


However, date is a dimension in Adobe Analytics and we cannot perform any function on it, so your request is a bit complicated.

The closest thing that comes to my mind is having page, or page url dimension as you wanted, as the first level dimension, then breakdown by year, month of year, and day of month. Limit to show only one item of each level of breakdown and make sure to sort descending by dimension values of each breakdown as pointed out in the image. You will also need to set each breakdown to "breakdown by position", so the breakdown is always on the first item instead of following the value item. There is a lot of work to do to set up such as a report.

Screenshot 2023-12-28 at 2.42.35 PM.png


If you don't need it absolutely an AA dashboard but only getting the data, pulling out page (or page URL) using Data Warehouse with a "daily" granularity, then do the "group by, max date" operation in Excel or any other tool can give you a quicker and cleaner solution.


One last thing, please be reminded if a page got no visit in the reporting date range, it will not show up. So if you are looking for some dormant pages, those dead pages are missing from this last access report.

Avatar

Correct answer by
Level 10

I tested using a segment in the following configuration, where the calendar date was set for a year.

RobertBlakeley_1-1703779560431.png

The segment I used finds the last page a visitor saw in the year.

RobertBlakeley_0-1703778775869.png

However, this gives you the last time any given visitor saw a page. So visitor 1 could have seen page A as the last page on Jan 1 and visitor 2 could have seen the same last page on Dec 1.

We would need to find the last page across all visitors. I don't know if that can be done with segments. Perhaps someone else does?


Avatar

Level 2

Hi @RobertBlakeley ,


Sorry for late reply,was occupied with couple of activities.

will try to implement the same.

Thanks for your reply