Solved
How do I create fallout calculated metric?
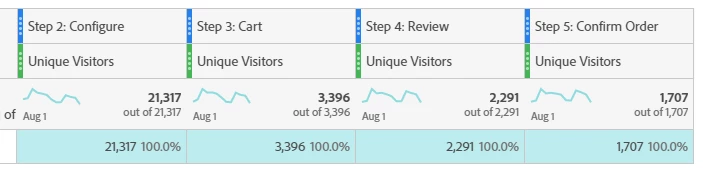
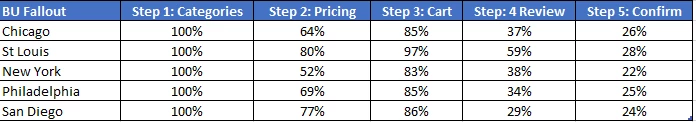
The ultimate goal here is to show a table of 200 geographic business units with their fallout % at each step of the purchase process so we can look for anomalies. In a fallout chart I can add the business units and show the comparison in the chart but more than 10 at a time is too much.
So how could i get it to something like this? The CSV export doesn't provide the columns & rows properly besides the fact that adding 200 BUs to the chart for export is not possible.
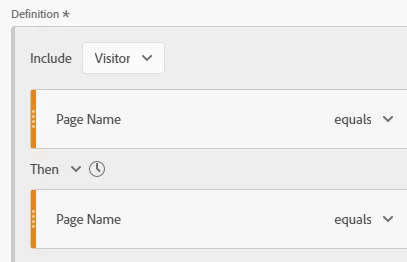
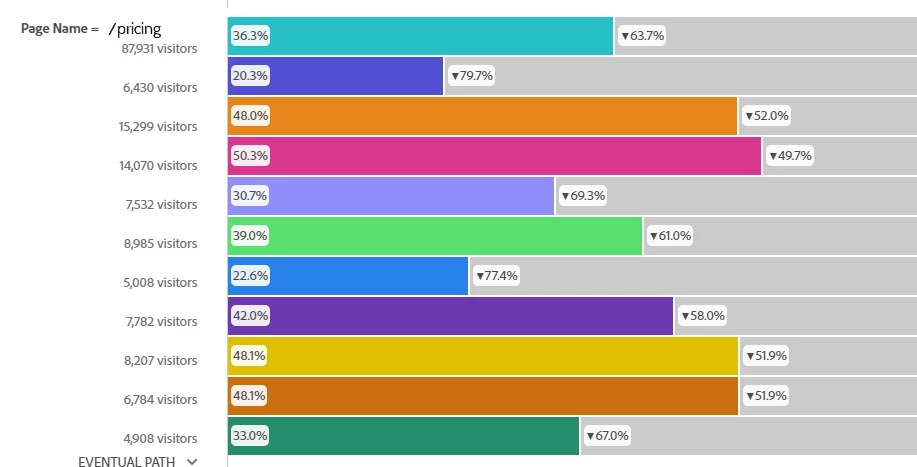
Building a free form table doesn't work because it's not using the logic of eventual path so the table has a higher visitor counts. If I could get the count of unique visitors by page name as eventual path then I could calculate the percentages myself.