Histogram in Workspace - Volumes Don't Match
I'm having issues getting the histogram visualization to deliver results that make sense.
I created a histogram in Workspace looking for a distribution of Page Views per Unique Visitor and applied a segment to the panel to limit the page to only the single page I'm interested in. My segment is a hit segment with Page = "page name X". My histogram settings are as follows:
Starting Bucket = 1
Metric Buckets = 5
Metric Bucket Size = 1
Counting Method = Visitor
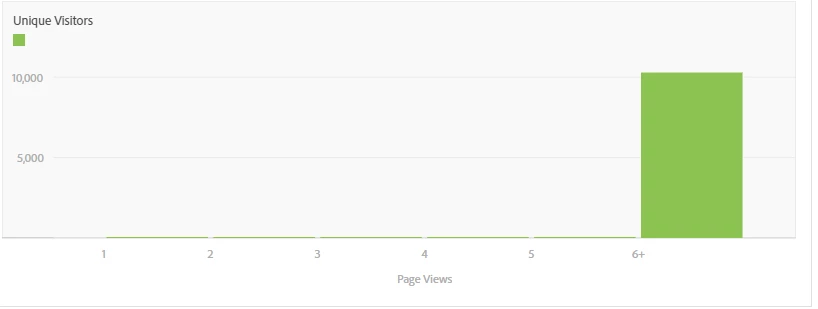
My results look like this:

The 6+ contains 10,285 Visitors, which would mean there are 10,285 Visitors with at least 6 page views of the page I filtered by (so I should have at least ~60K page views of that page for that time frame). However, I have only 14K page views for that time frame. It seems like this isn't giving me what I want. I validated via the segment and other reporting that my 14K page views is correct. How should I be building this Histogram to get the correct results I'm looking for (distribution of page views per visitor)?