Hi @rajeshwaripa1,
Generally, the purpose of a linear regression is to see how two variables are related to each other, by using the values of one to predict the values of another. For that, there are four pieces of data you need, the correlation coefficient, the slope, the intercept, and the predicted Y. Each of these gives you on part of the formula you need to predict values.
The predicted Y is the outcome of the regression formula. For example if you're using visits to predict how many orders will be placed on your site (using historical visit and order data), the predicted amount of orders will be the Y metric. So it does make sense that the predicted Y is constantly changing, because it depends on the historical data being used to determine the intercept, correlation coefficient, and the slope, and on the current value of X.
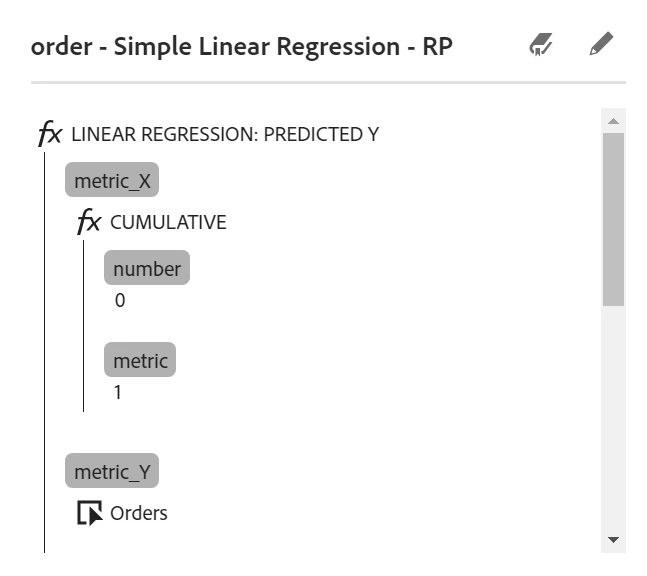
With what you have in your screenshot, you're using a cumulative value as your predictor, and it's predicting the number of orders that will be placed. So the Y you're seeing is the predicted order count, based on the formula.
I've actually just finished writing a playbook for adobe on how to use all 78 of the functions available in the metric builder (it should be published within the next couple months, I can come back and link it when it is published). Here is an excerpt from it about regressions.
Within each type of regression there are four functions: CORRELATION COEFFICIENT, INTERCEPT, PREDICTED Y, and SLOPE. Each of these will return a different part of the regression equation, Y = aX + b.
PREDICTED Y = Y
SLOPE = a
INTERCEPT = b
CORRELATION COEFFICIENT = Strength of the relationship between X and Y
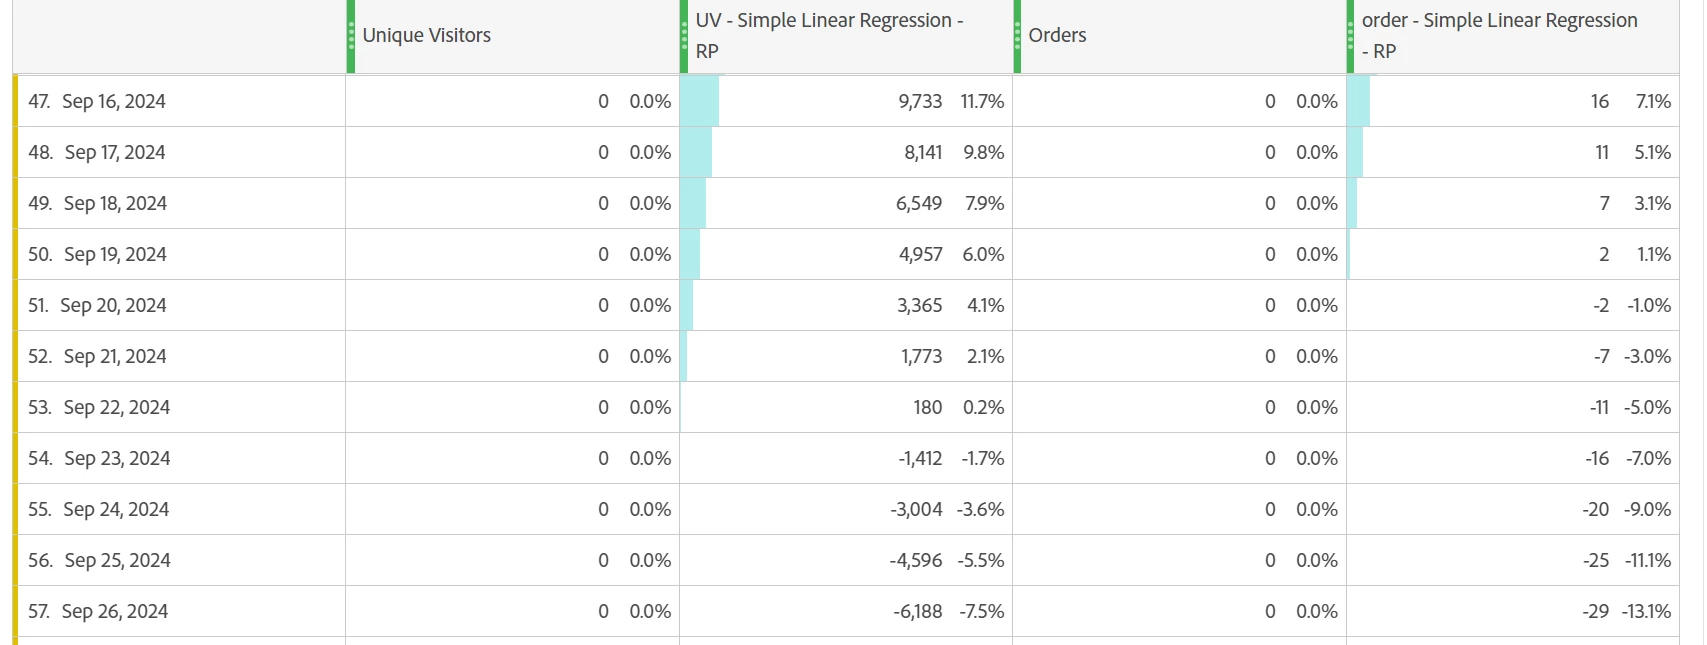
The PREDICTED Y is the final result of the regression formula. In your table, for the given value of the X metric on a specific row, it will return what the predicted value is for the Y metric. This can be useful when you are missing data in a metric, and you want to estimate what it should be. The results of a regression are generally accurate, but there will be some differences between the predicted values and what the true value is due to natural variance.
The SLOPE (the “a” in the above formula) is the actual correlation between the two variables and is used in the calculation to predict Y based on the value of X.
The INTERCEPT (the “b” in the above formula) is used to raise/lower the predicted values. If the metric X is 0, the predicted Y value would be equal to this intercept. Along with the slope, it is used to help predict the Y values.
The CORRELATION COEFFICIENT returns a value that indicates how strongly two metrics are associated with each other. It will return a value between -1 and +1. The further from zero the number is, the stronger the two metrics are related. If the result is positive that means when one metric increases, so does the other. If the result is negative that means when one metric increases the other decreases.