Green Bars in Adobe Analytics Workspace Tables | Community
Skip to main content
elenas13746095
August 1, 2017
Solved

Green Bars in Adobe Analytics Workspace Tables

  • August 1, 2017
  • 3 replies
  • 3911 views

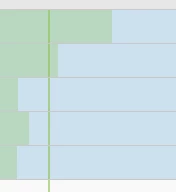
In data tables in Workspace (in those showing trends over time), green lines are visible (s. above). What do they mean?

This post is no longer active and is closed to new replies. Need help? Start a new post to ask your question.
Best answer by WhoaShekhar

Hi There,

Thank you for your query.

As stated above by other community members. If you un-check background it will turn off the horizontal chart bars and if you un-check "Anomalies" then the vertical line would be gone.

Anomalies are basically the unexpected events in a period of time. e.g. a sudden rise or fall in a metric.

Thanks!

3 replies

Level 4
August 1, 2017

Green bars is showing when you select 'Background' option from column settings. It determines if a cell shows/hides all cell formatting, including the bar graph and conditional formatting.

Adobe Employee
August 1, 2017

Hi elenas13746095

If you are referring to vertical green line, it represents the expected value. Basically, that is shown when "Anomalies" option is checked in Column settings.

Thanks!

WhoaShekhar
WhoaShekharAccepted solution
Level 10
August 21, 2017

Hi There,

Thank you for your query.

As stated above by other community members. If you un-check background it will turn off the horizontal chart bars and if you un-check "Anomalies" then the vertical line would be gone.

Anomalies are basically the unexpected events in a period of time. e.g. a sudden rise or fall in a metric.

Thanks!