Greater than 400 data points on scatter plot in workspace | Community
Skip to main content
November 17, 2022
Solved

Greater than 400 data points on scatter plot in workspace

  • November 17, 2022
  • 1 reply
  • 724 views

Hi All,


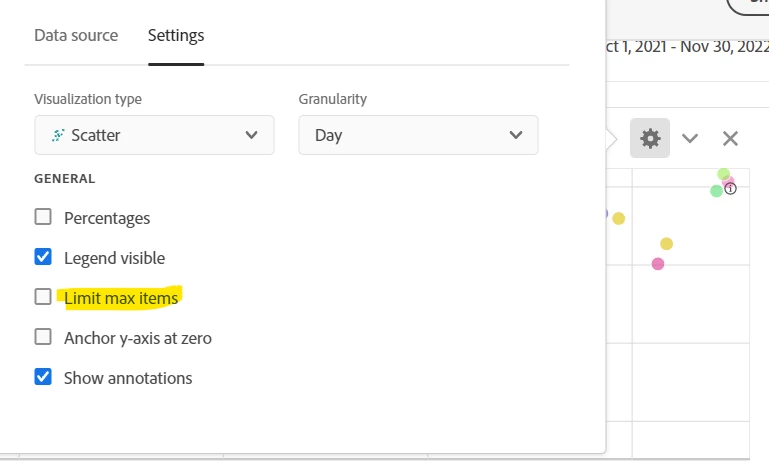
Looking to know if there is a way in workspace to produce a scatter with greater than 400 data points (x,y only).


Also if anyone knows if there is a way to visualise a linear trend line on a scatter plot in workspace that would be cool too.


Thanks in advance!

This post is no longer active and is closed to new replies. Need help? Start a new post to ask your question.
Best answer by Jennifer_Dungan

I believe the max you can get is 400 (by removing the limit on the visualization), since that is the limit for the Freeform table driving the Scatter Chart


I think if you want more than that, you may have to use Report Builder to bring the data into Excel and create your visualization there.


I don't think trend lines are available on Scatter Charts. This might be worthy of posting as an Idea for people to upvote?


1 reply

Jennifer_Dungan
Community Advisor and Adobe Champion
Jennifer_DunganCommunity Advisor and Adobe ChampionAccepted solution
Community Advisor and Adobe Champion
November 18, 2022

I believe the max you can get is 400 (by removing the limit on the visualization), since that is the limit for the Freeform table driving the Scatter Chart


I think if you want more than that, you may have to use Report Builder to bring the data into Excel and create your visualization there.


I don't think trend lines are available on Scatter Charts. This might be worthy of posting as an Idea for people to upvote?