Expand my Community achievements bar.

Join us at Adobe Summit 2024 for the Coffee Break Q&A Live series, a unique opportunity to network with and learn from expert users, the Adobe product team, and Adobe partners in a small group, 30 minute AMA conversations.
SOLVED

Flow Chart - meaning of the numbers

Avatar

Level 4

Hi guys,

i were testing the flow visualization and have an important question:

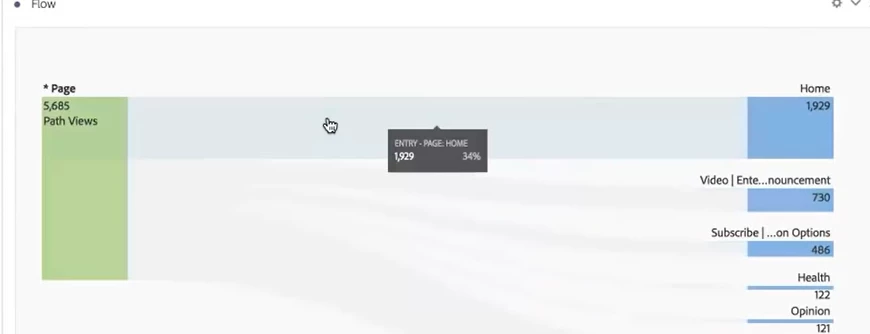
what does the number of path views generally mean? So for example i put the dimension page into the entry dropzone and get the number 5685 for path views and 1929 for the entry „Homepage“. Does it mean how many page views „homepage“ has generated or is it the number of visitors, whose entry page was „Homepage“?

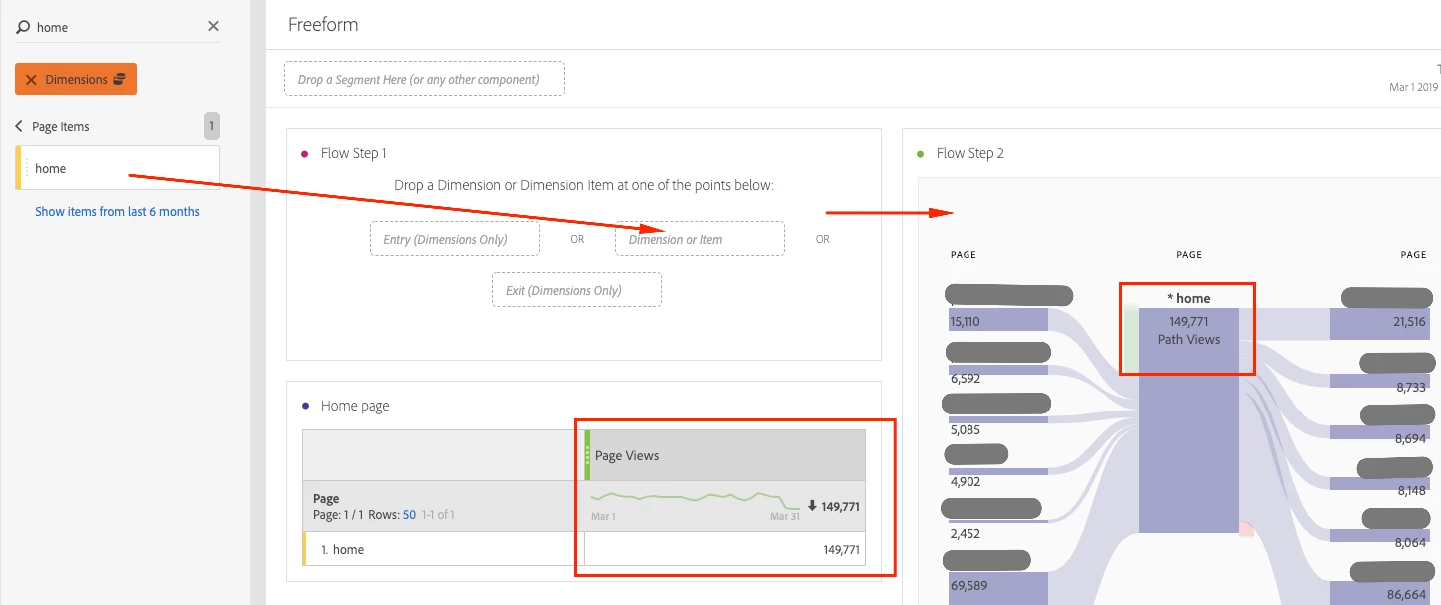
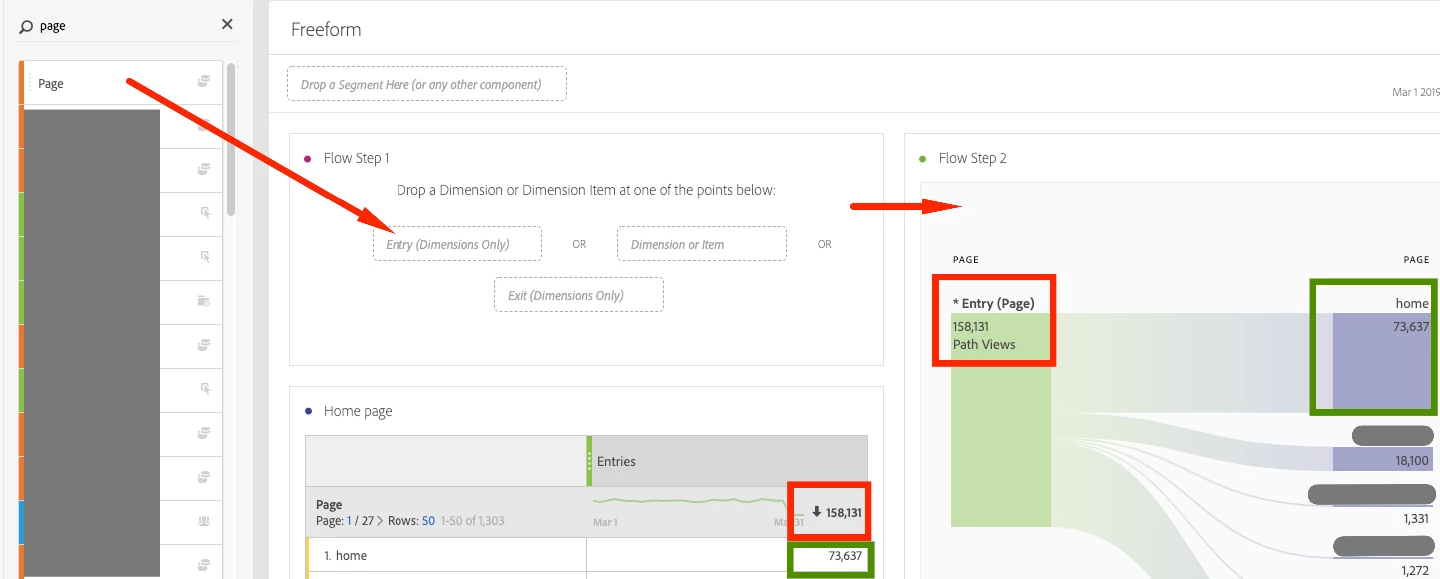
What i do not understand, is the fact, that one time the number indicates the number of page views and one time it indicates the number of entries (@Andrey Osadchku told me so ). When do i see the page views and when do i see the number of entries? And Can someone tell me this fact in Connection with the following screenshot?

What i do not get, is what the 5685 pathiews is different from the number of "Homepage" 1929. if I understand you correctly the 5685 path views generate 1929 entrys for "Homepage"? I do not get the difference for this case, where i can see the page views and what the number of entrys are. Because you said that in one case pathviews indicates the number of page views and in the other case the number of entries. but what are the different cases?

thank you so much!

1720782_pastedImage_0.png

1 Accepted Solution

Avatar

Correct answer by
Level 10

Hi Amigo,

When you begin with the Flow visualisation, you have three area to drop a dimension on. This is the differentiator.

Scenario 1. Drop Page onto the second zone.

The number of path views will match the number of page views.

Flow Visualisation 1.png

Scenario 2. Drop Page onto the first zone.

Click on gear icon and switch to Visit.

Now the number of Path Views under the page value shows the number of times this page was the first during a visit (number of entries). And *Entry (Page) shows total number (all pages aggregated).

Flow Visualisation 2.png

Flow Visualisation 2.1.png

View solution in original post

3 Replies

Avatar

Correct answer by
Level 10

Hi Amigo,

When you begin with the Flow visualisation, you have three area to drop a dimension on. This is the differentiator.

Scenario 1. Drop Page onto the second zone.

The number of path views will match the number of page views.

Flow Visualisation 1.png

Scenario 2. Drop Page onto the first zone.

Click on gear icon and switch to Visit.

Now the number of Path Views under the page value shows the number of times this page was the first during a visit (number of entries). And *Entry (Page) shows total number (all pages aggregated).

Flow Visualisation 2.png

Flow Visualisation 2.1.png

Avatar

Level 4

Hi,

thank you for your great answer in detail, very helpful!

Just two Shorts Question:

Scenario 1: Drop Page onto the second Zone (first screenshot)

- so in this case we have 149.771 page views for "home". Are the numbers to the left and to the right of home (for example the 15.110 and 21.516) also page views for the corresponding pages, which were achieved before and after home? So what does the number say in this case before and after that?

Scenario 2: Drop Page onto the first Zone (second screenshot)

- this scenario shows the number of times this page was the first during a visit (e.g. "Home" in this case 76.637 entries). So for example if i click on "home", in the next step i would still see the number of entries but now for the pages which follows after "Home"? So what i mean is that i would see Always the number of entries in this scenario?

thanks for your great help

Avatar

Level 4

Can someone help me with the Question? Thanks