This would probably be a great use for the cumulative average function in a calculated metric. If you go into the calculated metric builder, at the bottom there is a section called "functions", in here there are a ton of different functions that you can use in your calculated metric. The cumulative average is the one that you want here.
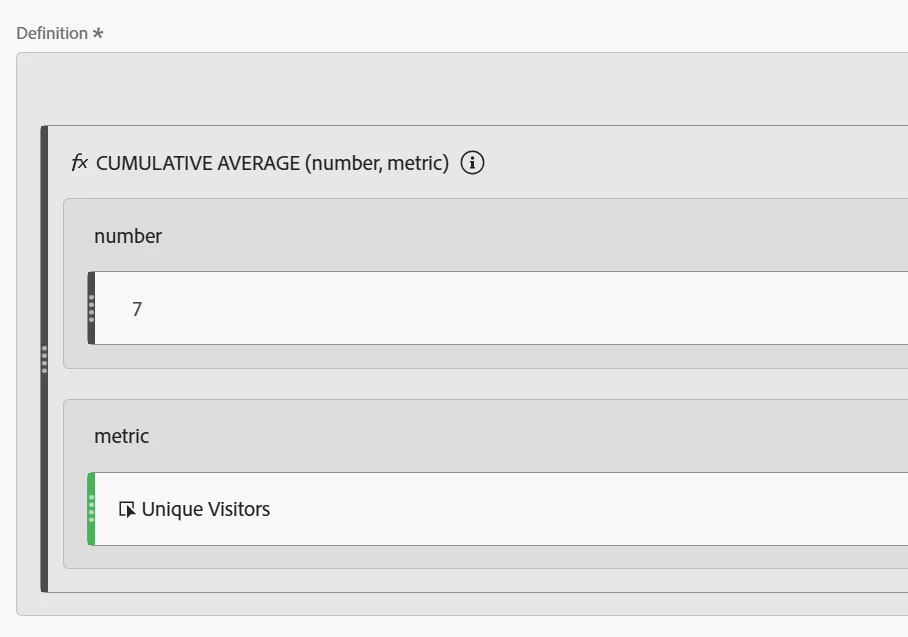
The cumulative average calculates an average value for whatever metric you select for the last X number of rows. In the screenshot below, this is how to build it. Under number you would put 7, because you want a rolling 7 day average. This means that for each row, it is going to calculate the average of the last 7 rows. Then you put in the metric that you want to average, in this case you mentioned unique visitors.
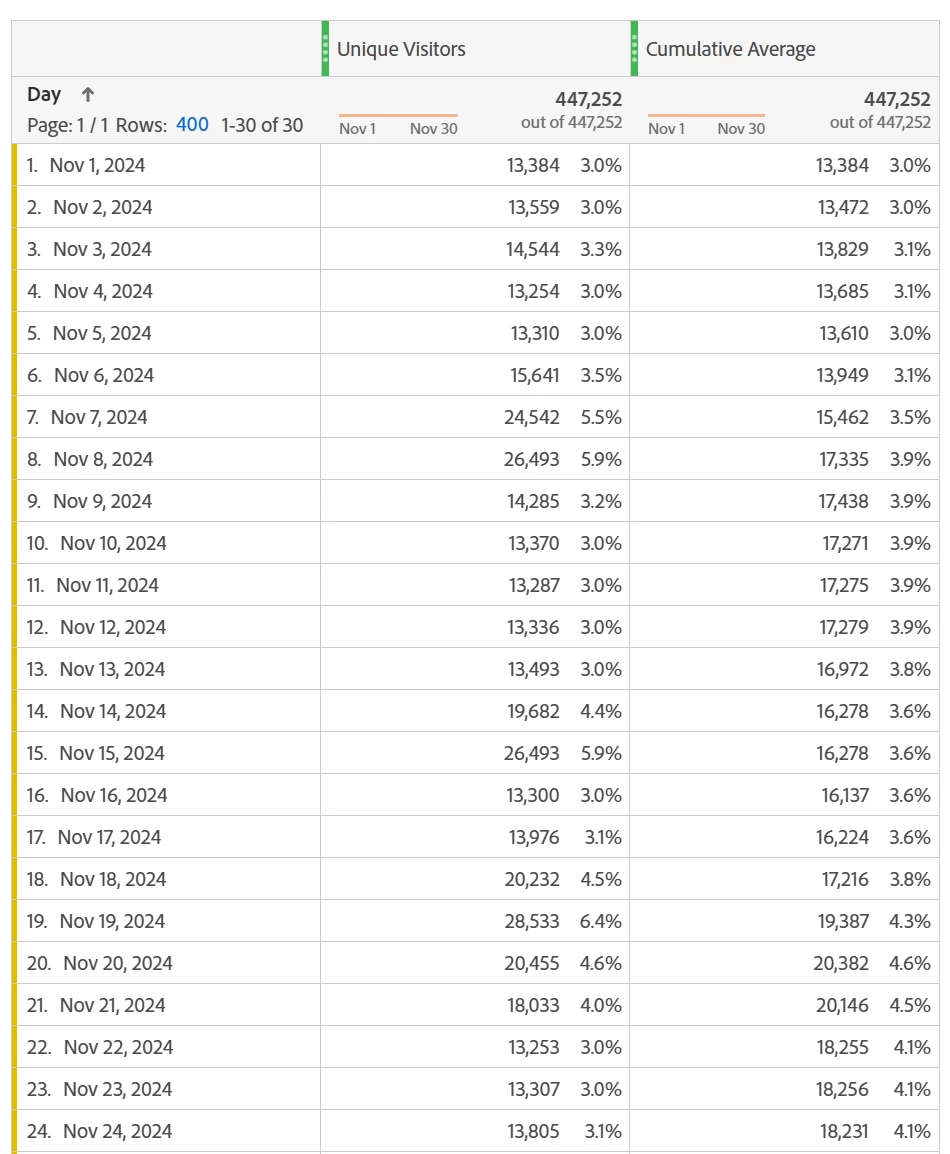
Once you put that in your table, put it against the dimension day. This way it uses the days to calculate the average. The table below is demo data, but it should still give you a good idea of how this works. For my date range I just did November 2024. So the first row, Nov 1, the average is the same as the unique visitors because there is only 1 row. Nov 2 it takes the average of Nov 1 and Nov 2. And so on. By the time we get to Nov 7, it now has 7 rows of data to average. So Nov 7, and every row after that will be the average of the last 7 days (the current row + the 6 previous ones).
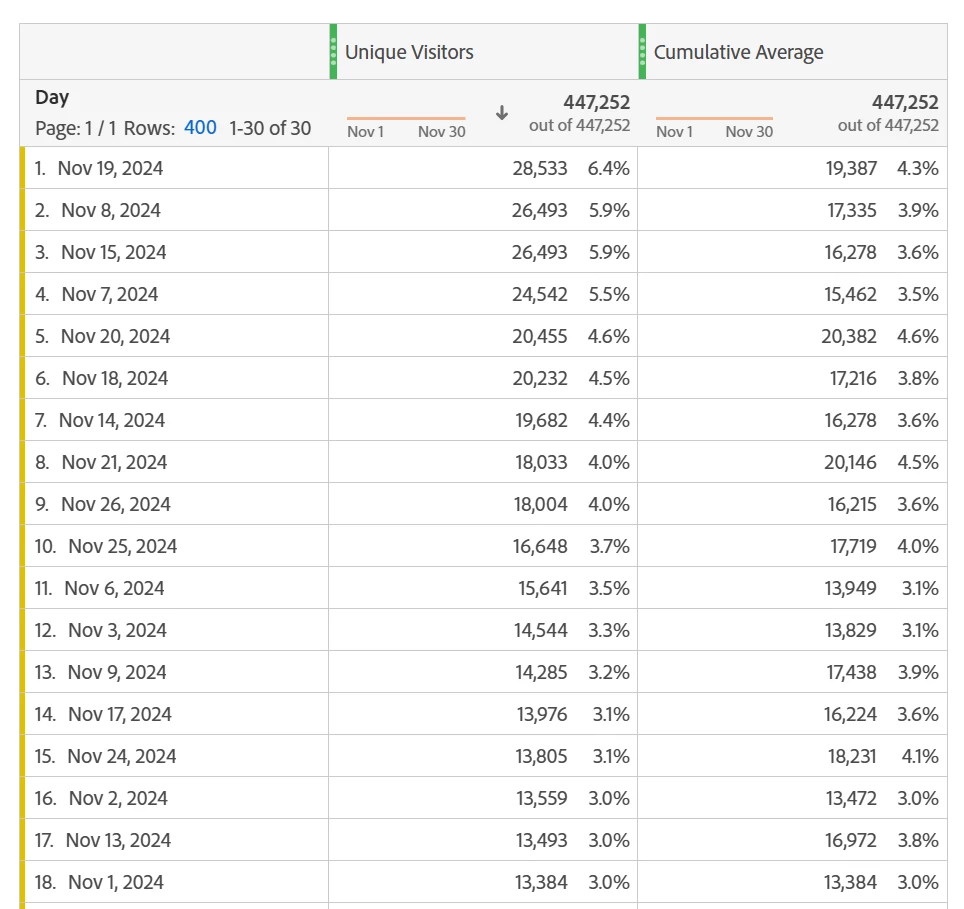
The cool thing about cumulative averages is that it works based on the time dimension (in this case, days). It depends on the value in the dimension, not the order of it. What that means is that you can have the days in order like in the screenshot above, or you can sort by another column, having the days not in order. It will still calculate properly. If you look at the screenshot below, you can see Nov 1 is now on row 18, but it is still only calculating the average based on the single day. If you look at the values in the screenshot above and below, you will find all of the days still match up in terms of values.
If you want the most recent 7 days, sort by your time dimension with the newest value at the top (or bottom) of the table, and then you can create a summary number off of it's position. Otherwise you can see all the rolling averages in a table.