I think I know what is happening...
I noticed that you are testing a dev environment (i.e. Localhost).
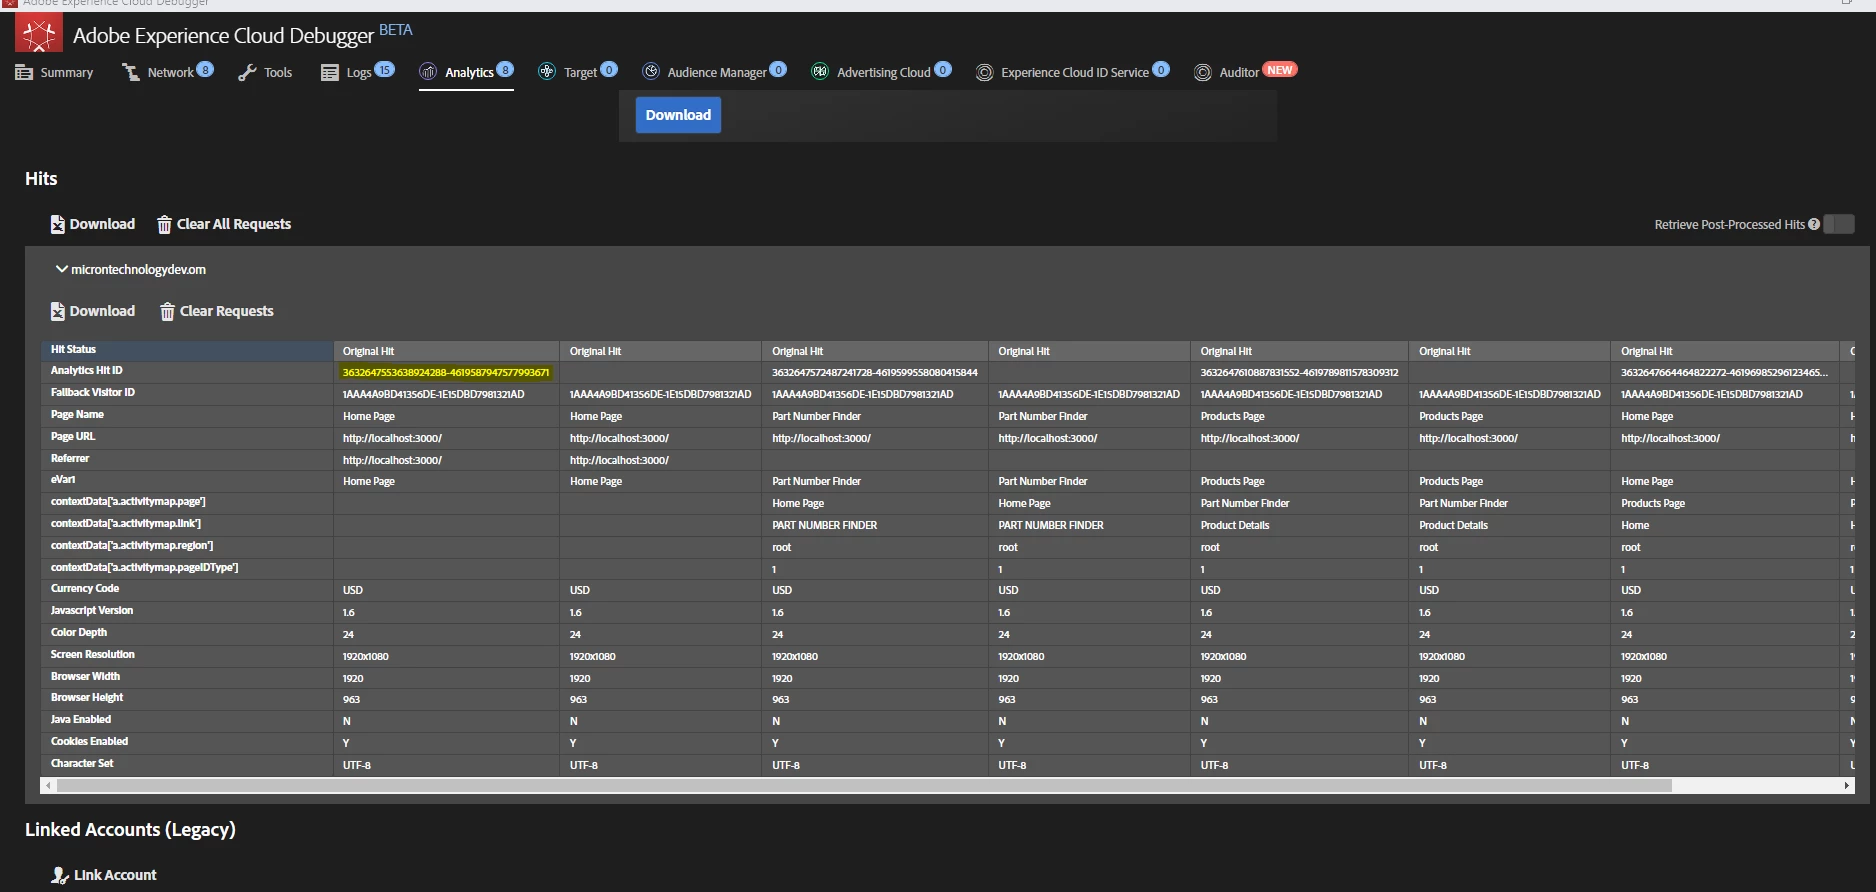
The ECID cannot be set on Localhost... now, when the ECID is first set (or attempted to be set), the very first call actually gets redirected (so that the value can be obtained to be included on the call)... the first call (the one that is redirected) doesn't actually track anything, it's the second call that does (since it has the proper fingerprinting), but both calls show up in the debugger... (if the ECID fails to set, a fallback id is set instead - and I can see your fallback id in your tracking calls)
When the ECID cannot be set, every single call does this "double" appearance in the debugger. Its very annoying and makes it difficult to identify real "double tracking calls".
You can confirm this by using your browser's Network panel and filtering for "b/ss"
If you clear it out, then load a page, you should see two hits.. one should have a 307 redirect status code, and the other will have a 200 status code.