Solved
Difference in totals when segmenting a custom metric
I'm looking at some data for a particular page in my journey YTD, so there is a calculated metric to provide figures for unique visits to that page month by month.
However when i duplicate the table and break it down further by a custom segments to split this figure between age ranges for some reason the total of all the new columns is more than the original.
I know there is some data that falls outside the age ranges i have asked for and even some showing as unspecified, but these would surely add even more to this new total.
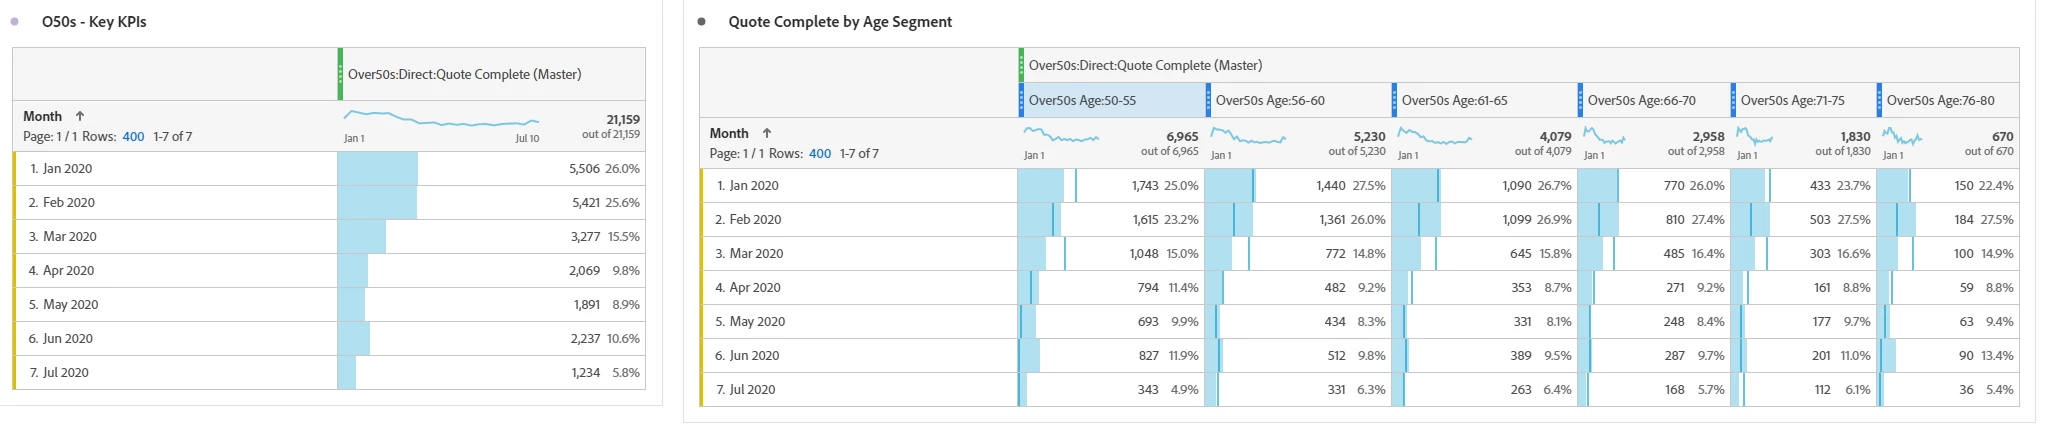
The totals of the table on the right are 21732 compared to the original(base) figure of 21159
Any idea what is happening?